Over the past decade US life insurers have shifted more of their general accounts into private credit, structured credit and other less liquid fixed income, often alongside or owned by alternative-asset managers. The decision for an investor, lender or supervisor is whether the market now prices insurers as credit vehicles, and how much credit risk an insurer position really carries.
I tested it on weekly total returns from January 2008 to October 2026 for ten life insurers and four alternative-asset managers, measuring each group's sensitivity to the stock market, long-term interest rates and credit spreads at the same time.
Executive summary
The question. Has the equity of US life insurers become a bet on credit spreads, and how does that compare with the alternative managers that originate the credit?
The approach. 983 weeks of total returns. Three groups: traditional life and benefits insurers (MetLife, Prudential, Principal, Unum, Globe Life), annuity-heavy insurers (Lincoln, Brighthouse, Equitable, Jackson, Corebridge) and alternative managers (Apollo, KKR, Blackstone, Ares). Each was regressed on the S&P 500, long Treasuries and a credit factor: high-yield bond returns with their equity and Treasury exposure removed. Betas were compared across 2008–2015 and 2016–2026, with and without the Covid crash, alongside rolling betas and four stress windows.
The answer. Insurers' sensitivity to credit spreads went from roughly zero to well above one. Traditional insurers' credit beta rose from 0.27 to 1.22, and annuity-heavy insurers' from 0.03 to 2.11; in 2024–2026 alone it was 2.2 and 2.9. The alternative managers' credit beta changed little (0.49 to 0.78), so since 2016 the annuity-heavy insurers have been more of a credit bet than the managers.
The decision. Treat insurer equity as a leveraged credit position: measure and limit its credit beta alongside its equity beta, and stress it with credit scenarios, not only equity ones.
Business outcomes
| Decision | What the data showed | What it means |
|---|---|---|
| Hold insurers as a value or rate play | Credit beta 1.22 (traditional) and 2.11 (annuity-heavy) since 2016, both t ≥ 6; 2.2 and 2.9 in 2024–2026 | The position now carries a large credit-spread bet |
| Assume the shift is a Covid artefact | Without February–April 2020: 0.88 and 1.45, still significant | The change is structural, not one crash |
| Use insurers to diversify alternative managers | Managers' credit beta 0.78 since 2016, below the annuity-heavy insurers' 2.11 | Owning both doubles up on credit |
| Count insurers as rate beneficiaries | Long-Treasury beta −0.48 and −0.66 since 2016: they rise when yields rise | True, but now with credit risk attached |
| Size a $100M annuity-heavy insurer position | Credit beta 2.11 × 8.6% credit-factor volatility ≈ $18M one-standard-deviation swing a year, plus ~$188M of S&P 500-equivalent exposure | Credit risk the equity beta does not show |
Weekly total returns, January 2008 to October 2026. Betas from a regression on SPY, TLT and the credit factor with Newey-West t-statistics. Dollar figures apply the measured betas and factor volatility to an illustrative $100M position.
End to end in five steps
| Step | What happens | Output |
|---|---|---|
| 1. Source | Daily prices and dividends for 10 life insurers, 4 alternative managers, SPY, TLT and JNK | Checksum-pinned public data |
| 2. Returns | Daily total returns, compounded to Friday-to-Friday weeks; jump screen | 983 weeks, 2008–2026 |
| 3. Credit factor | High-yield (JNK) returns minus their fitted equity and Treasury exposure | A pure credit-spread series, 8.6% a year volatility |
| 4. Betas | Each group and company on equity, rates and credit, by period, with and without the Covid crash; rolling two-year betas | Has credit sensitivity changed? |
| 5. Stress | Returns in the 2008 crisis, the Covid crash, the 2023 bank failures and the 2025 tariff shock | What it costs when spreads widen |
The data
Daily closing prices and dividends from the public defeatbeta Yahoo Finance mirror on Hugging Face (ODC-BY), pinned by checksum. Groups are equal-weighted across the members trading each week; Brighthouse, Equitable, Jackson and Corebridge listed between 2017 and 2022, so before 2017 the annuity-heavy group is Lincoln alone. The SPDR Bloomberg High Yield Bond ETF (JNK) provides the credit series; the iShares 20+ Year Treasury Bond ETF (TLT) the rate series. A screen for one-day jumps flagged one move, Globe Life's −53% on 11 April 2024 after a short-seller report; it is a genuine price move and is kept.
How the credit factor is built
High-yield bonds move with stocks and with Treasuries. Regressing JNK's weekly return on the S&P 500 and long Treasuries gives an equity beta of 0.50 and a Treasury beta of 0.09; what is left over is the part of high-yield returns driven by credit spreads and defaults. That residual is the credit factor. Each insurer group's credit beta measures how much it moves with spreads after accounting for its stock-market and rate exposure.
The results
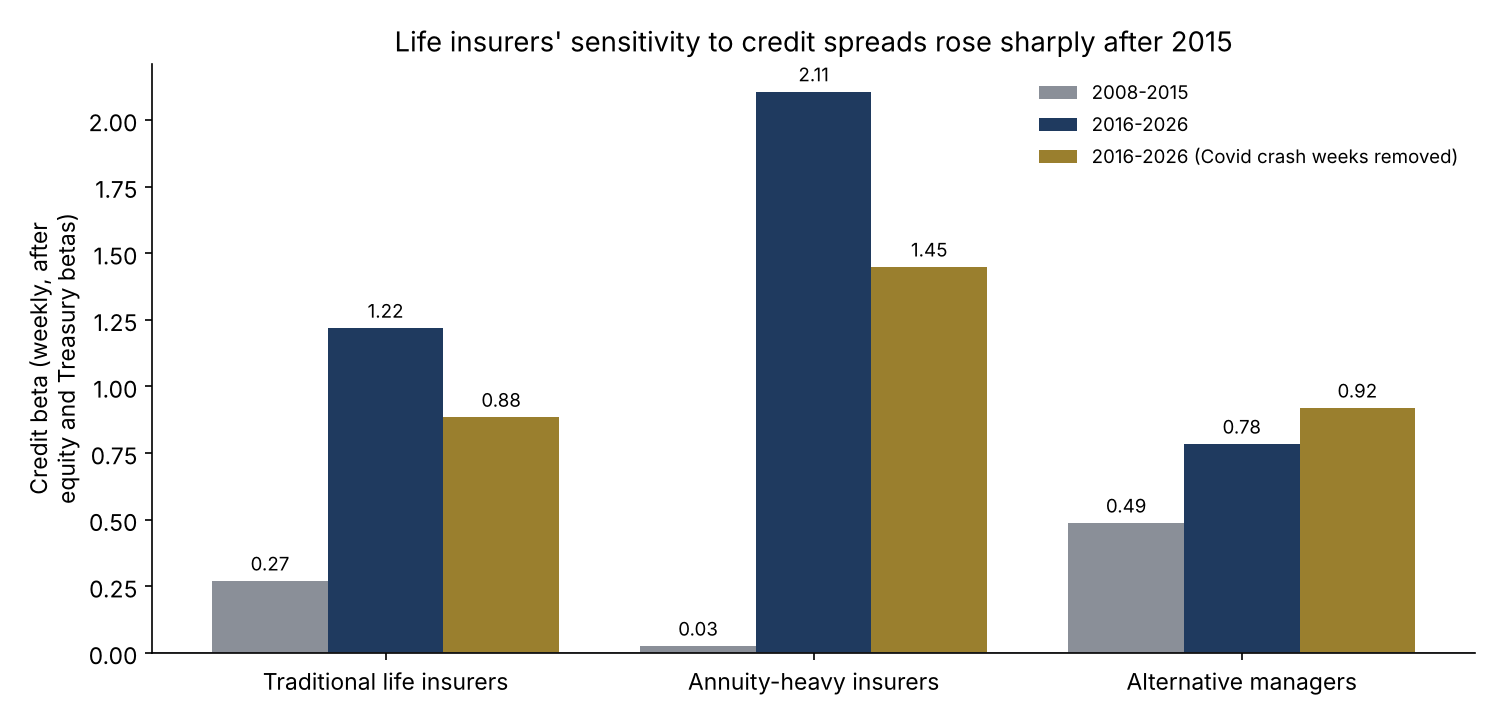
In 2008–2015 the insurers' credit beta was small and not significant: 0.27 for traditional insurers and 0.03 for annuity-heavy ones. In 2016–2026 it was 1.22 and 2.11, with t-statistics of 6.4 and 6.0. The Covid crash, when spreads and insurer stocks collapsed together, accounts for part of that: removing February to April 2020 leaves 0.88 and 1.45, still clearly significant. The change shows up in every name: MetLife 0.21 to 1.11, Prudential 0.32 to 1.18, Principal 0.49 to 1.29, Unum 0.22 to 1.55, Globe Life 0.10 to 0.97, and Lincoln 0.03 to 2.64.
The alternative managers moved far less. Apollo's credit beta was 1.17 in 2008–2015 and 1.01 since; KKR's 0.83 and 0.70; Blackstone's 0.42 and 0.66. As a group they went from 0.49 to 0.78.
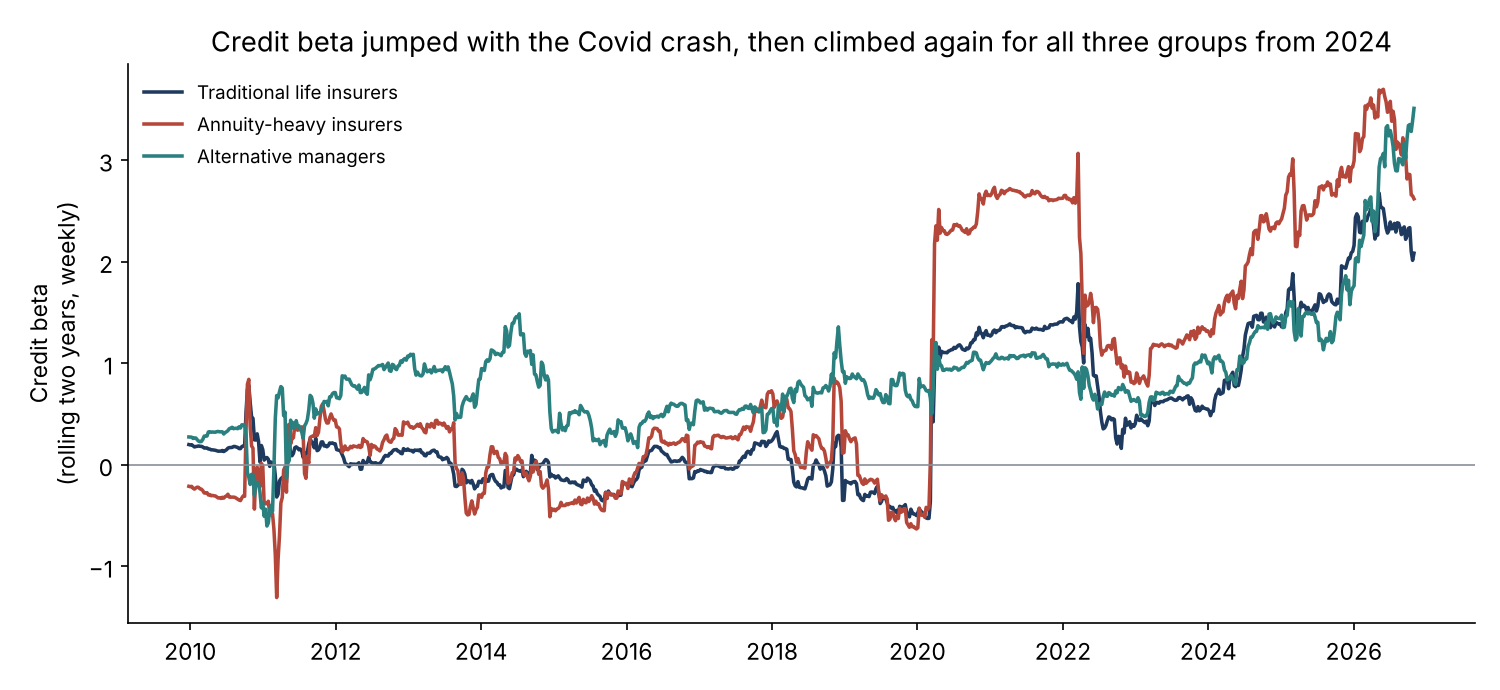
The rolling view shows two steps. The first came with the Covid crash in 2020 and dropped out of the window two years later. The second has built since 2024 and lifted all three groups: by October 2026 the two-year credit beta was 2.1 for traditional insurers, 2.6 for annuity-heavy insurers and 3.5 for the managers. Over 2024–2026 as a whole the figures are 2.2, 2.9 and 2.6.
| Window | Traditional insurers | Annuity-heavy insurers | Alternative managers | S&P 500 | High-yield bonds | Long Treasuries |
|---|---|---|---|---|---|---|
| 2008 crisis (12 Sep 2008–9 Mar 2009) | −76.8% | −89.9% | −63.1% | −45.0% | −34.1% | +9.8% |
| Covid crash (19 Feb–23 Mar 2020) | −56.3% | −65.5% | −44.0% | −33.4% | −22.7% | +14.2% |
| Bank failures (8–17 Mar 2023) | −17.4% | −24.6% | −11.8% | −1.7% | −1.3% | +5.0% |
| Tariff shock (2–8 Apr 2025) | −15.4% | −18.0% | −18.3% | −11.5% | −4.0% | −3.4% |
Total returns compounded from daily data. Annuity-heavy insurers in 2008 are Lincoln alone.
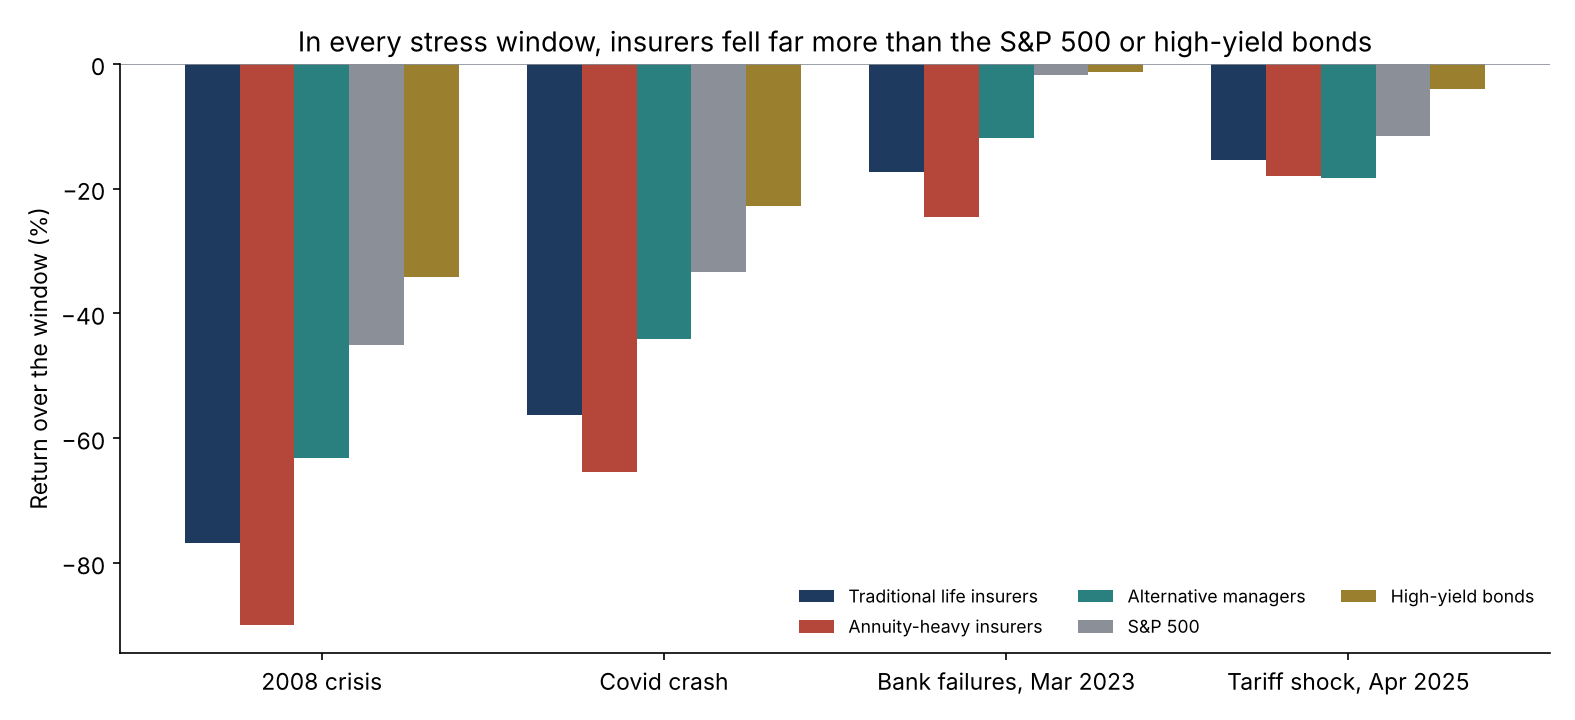
The March 2023 window is the clearest test of a credit-and-funding scare without an equity crash: the S&P 500 fell 1.7% and high-yield bonds 1.3%, while the insurers fell 17% to 25%.
Recommendations
- Decision: treat insurer equity as leveraged credit plus equity plus a positive rate exposure, and size it on all three.
- Limits: set a combined credit-beta limit across insurers and alternative managers; holding both doubles up on the same spread risk.
- Stress testing: add a credit-spread shock on its own, like March 2023, not only equity drawdowns.
- Monitoring: track rolling two-year credit betas monthly; all three groups have climbed since 2024.
- For lenders and supervisors: read a falling insurer share price as an early signal on the market's view of its credit book, and compare it with the reported marks.
Limits
- The credit factor is built from one high-yield fund; investment-grade and private credit spreads are not observed directly.
- Groups are small and their membership changes as companies list; before 2017 the annuity-heavy group is Lincoln alone.
- The credit factor is estimated on the full sample; betas are descriptive, not forecasts.
- Stock prices reflect many things besides the investment portfolio, including variable-annuity hedging, reserves and capital actions.
- Independent research on public data. Not deployed; not investment advice.
How it was built

Sources
Data
- Daily prices and dividends: defeatbeta, "yahoo-finance-data", huggingface.co/datasets/defeatbeta/yahoo-finance-data, ODC-BY; files
stock_pricesandstock_dividend_events, downloaded 1 November 2026 and pinned by sha256.
Methods referenced
- Fama, E. F. and French, K. R. (1993). "Common Risk Factors in the Returns on Stocks and Bonds." Journal of Financial Economics 33(1), 3–56.
- Newey, W. K. and West, K. D. (1987). "A Simple, Positive Semi-definite, Heteroskedasticity and Autocorrelation Consistent Covariance Matrix." Econometrica 55(3), 703–708.
Independent research on public data, not investment advice; dollar figures are illustrative. Analysis, code, charts and text were produced with AI assistance and reviewed by the author.