Commodity desks, multi-asset portfolios and natural-resources funds often hold mining stocks as a geared way to own a metal: if gold rises 10%, the miner should rise more, because its costs are mostly fixed. The decision is whether that gearing is real, whether it pays, and how much of the position's risk is not the metal at all.
I tested it on weekly total returns from January 2008 to October 2026 for gold, silver and copper, the large listed miners of each, two gold royalty and streaming companies, and the S&P 500.
Executive summary
The question. Does owning the miners give a portfolio leveraged exposure to the metal, and is that a better way to own it than the metal itself?
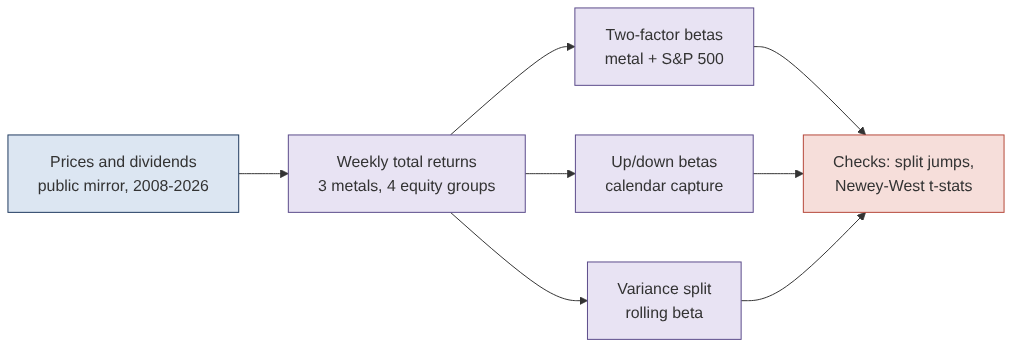
The approach. Weekly total returns, dividends reinvested: 983 weeks for gold and silver, 781 for copper (from November 2011). Each equity group was regressed on its metal and the S&P 500 at the same time, with the variance split into metal, market and company-specific parts, up and down betas, calendar-year capture and rolling two-year betas.
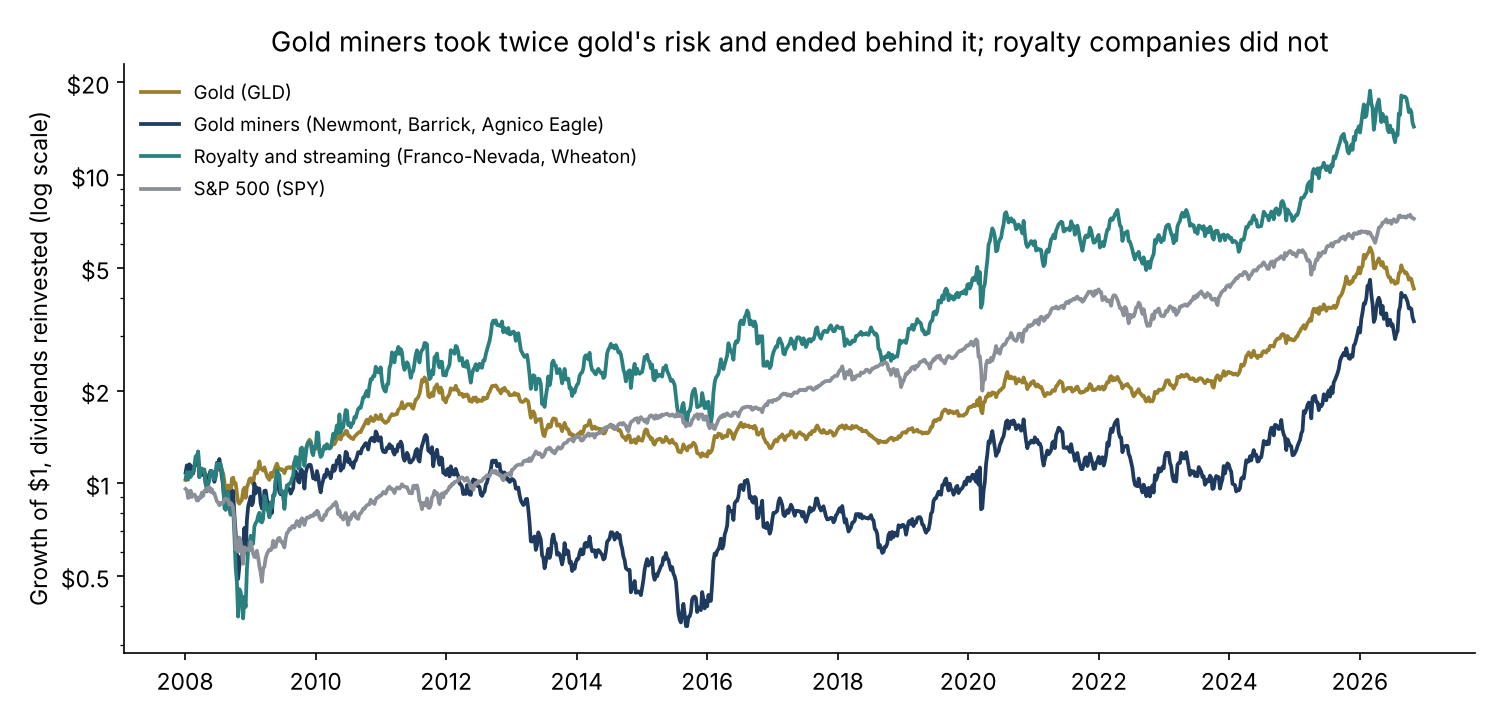
The answer. Only the gold equities were geared to their metal. Gold miners moved 1.68 times gold, but returned 6.6% a year against gold's 8.0%, at 37.8% volatility against 17.1%, with a worst drawdown of −77%. Royalty companies had a similar gold beta and returned 15.1% a year. The silver miner moved one for one with silver and returned 1.8% a year against silver's 6.1%. Copper miners moved one for one with copper and almost as much with the S&P 500.
The decision. Decide which exposure the mandate wants, the metal or the equity, and size each on its measured betas, not on the label. A mining stock is a metal position, a stock-market position and a company position in one.
Business outcomes
| Decision | What the data showed | What it means |
|---|---|---|
| Use gold miners as geared gold | Beta 1.68 to gold and 0.38 to the S&P 500; 6.6% a year vs gold's 8.0%; alpha −6.4% a year (t = −1.2) | The gearing was real; the reward for it was not |
| Use royalty and streaming companies | Beta 1.56 to gold; 15.1% a year; alpha about zero; down-week beta 1.73 vs up-week 1.44 | Better outcome, two companies, and more gearing when gold falls |
| Use a silver miner for silver | Beta 1.0; 1.8% a year vs silver's 6.1%; 48% of risk company-specific | No gearing, a lower return and more risk |
| Use copper miners for copper | Beta 0.97 to copper and 0.88 to the S&P 500; copper explains 29% of the risk | Half a copper position, half an equity position |
| Size a $100M gold-miner position | About $168M of gold exposure, $38M of S&P 500 exposure, a $23M one-standard-deviation company swing a year | The position is bigger and broader than its notional |
Weekly total returns, January 2008 to October 2026 (copper from November 2011). Betas from a two-factor regression on the metal fund and SPY. Dollar figures apply the measured betas and residual volatility to an illustrative $100M position.
End to end in five steps
| Step | What happens | Output |
|---|---|---|
| 1. Source | Daily prices and dividends for GLD, SLV, CPER, ten miners and royalty companies, and SPY | Checksum-pinned public data |
| 2. Returns | Daily total returns, compounded to Friday-to-Friday weeks; screened for split-like jumps | 983 weeks (copper 781) |
| 3. Betas | Each group regressed on its metal and the S&P 500 together, Newey-West t-statistics; up and down betas | How much metal, how much market |
| 4. Risk split and stability | Variance split into metal, market, overlap and company; rolling two-year betas | How much of the risk is the metal |
| 5. Outcomes | Annual return, volatility, drawdown; average returns in strong, flat and weak metal years | What the gearing delivered |
The data
Daily closing prices and dividends from the public defeatbeta Yahoo Finance mirror on Hugging Face (ODC-BY), pinned by checksum. Metals are held through exchange-traded funds: SPDR Gold Shares (GLD), iShares Silver Trust (SLV) and the United States Copper Index Fund (CPER), which holds copper futures and so bears their roll cost. Equity groups are equal-weighted and rebalanced weekly: gold miners Newmont, Barrick and Agnico Eagle; royalty and streaming companies Franco-Nevada and Wheaton Precious Metals; silver miner Pan American Silver; copper miners Freeport-McMoRan, Southern Copper and Teck. The sample starts in January 2008, the first full month of Franco-Nevada's price history in the mirror, and in November 2011 for copper, when CPER began trading.
How much metal is in a miner?
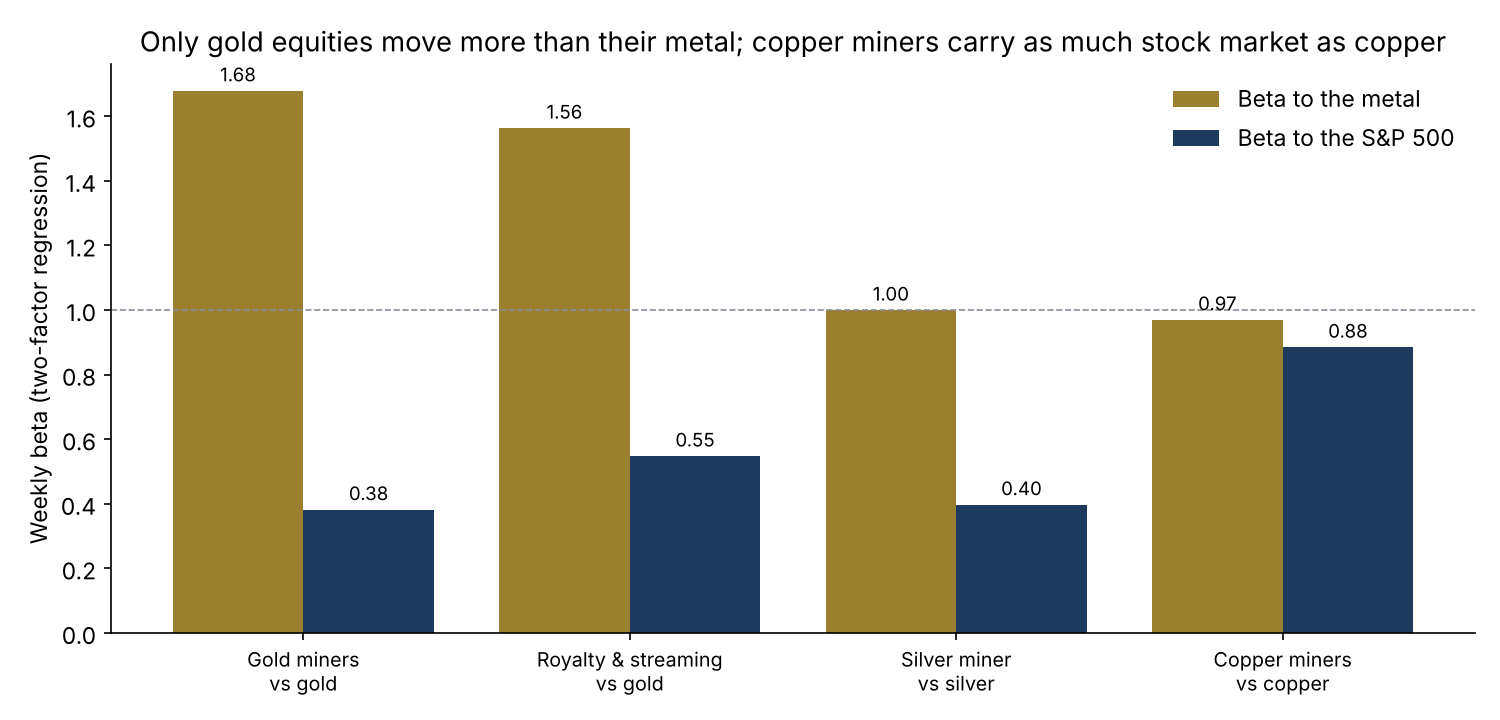
Gold equities were geared to gold: 1.68 for the miners and 1.56 for royalty companies, both strongly significant. The silver miner moved one for one with silver. Copper miners moved one for one with copper and 0.88 with the S&P 500, so a copper-miner position is close to equal parts copper and equity market.
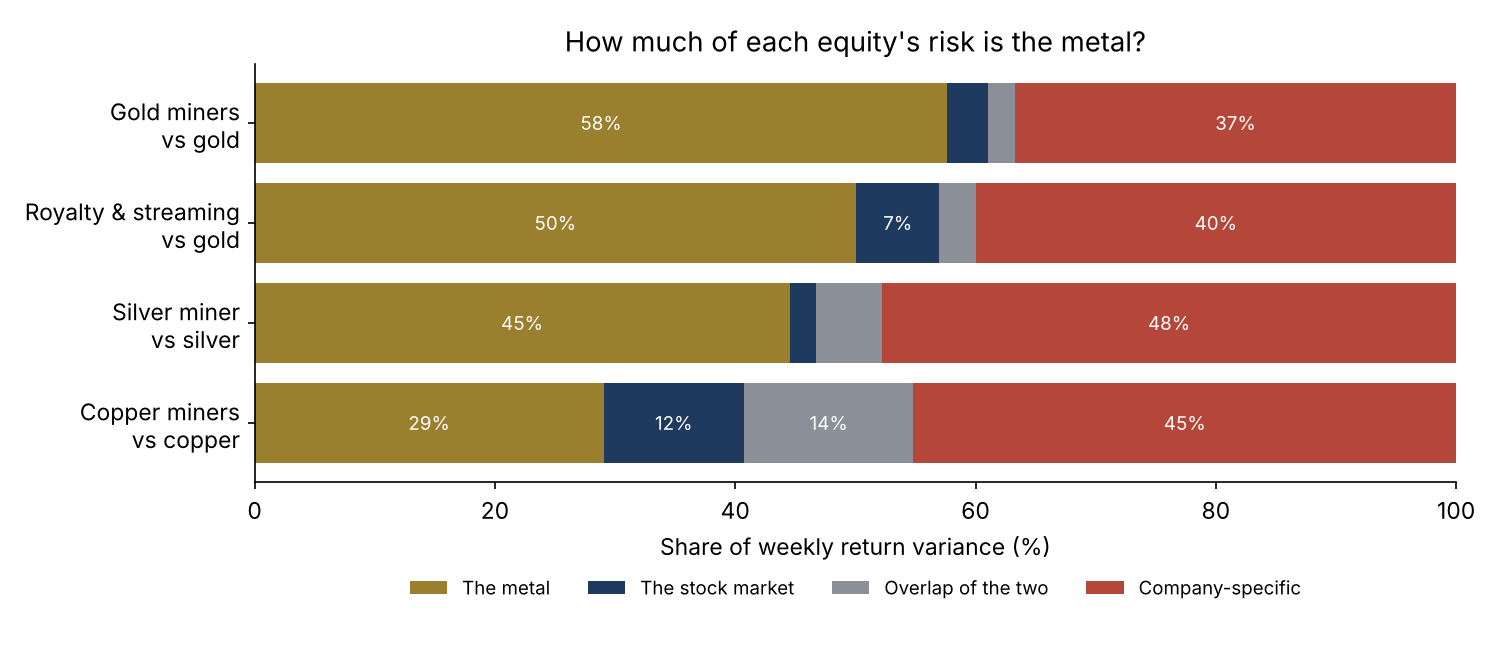
Even for gold miners, 37% of the weekly variance was company-specific: mine costs, reserves, acquisitions, jurisdictions. For the single silver miner it was 48%, and copper explained only 29% of copper miners' risk.
Did the gearing pay?
| Holding | Annual return | Volatility | Worst drawdown | Alpha after metal and market betas |
|---|---|---|---|---|
| Gold (GLD) | 8.0% | 17.1% | −44.7% | – |
| Gold miners | 6.6% | 37.8% | −76.7% | −6.4% (t = −1.2) |
| Royalty and streaming | 15.1% | 37.8% | −71.3% | +0.3% (t = 0.1) |
| Silver (SLV) | 6.1% | 32.6% | −75.2% | – |
| Silver miner | 1.8% | 48.8% | −84.3% | −2.3% (t = −0.3) |
| Copper fund (CPER), from Nov 2011 | 3.0% | 22.6% | −53.3% | – |
| Copper miners, from Nov 2011 | 11.2% | 40.7% | −79.3% | +0.3% (t = 0.0) |
| S&P 500 (SPY) | 11.0% | 18.2% | −50.8% | – |
Weekly total returns. Alpha is the annualised intercept of the two-factor regression; none is statistically different from zero.
Gold miners delivered the gearing in both directions. In the six calendar years gold rose more than 15%, gold averaged +32.5% and the miners +49.0%. In the twelve flat years, gold averaged +1.5% and the miners +0.1%. In 2013, the one year gold fell more than 15%, gold fell 27% and the miners 46%. The flat years are what cost them: twice the risk for no extra return most of the time.
Royalty companies, which buy a share of future metal output for an upfront payment and carry no mine operating costs, did much better with a similar gold beta. Their beta was higher in weeks gold fell (1.73) than in weeks it rose (1.44), and the basket is only two companies, so this is not a general law.
Copper miners beat the copper fund (11.2% against 3.0% a year) mainly because the fund lost to futures roll costs and the miners carried a large equity-market beta through a strong stock market. Neither group showed alpha.
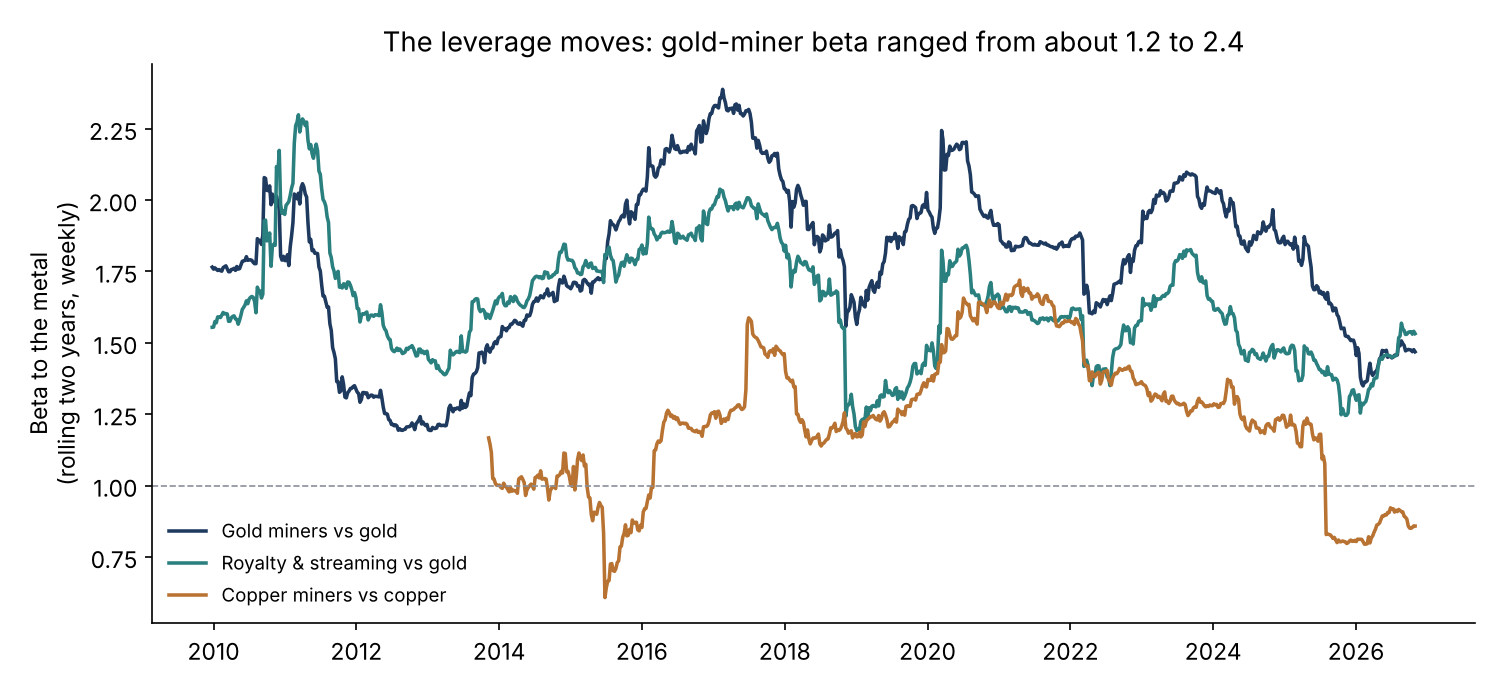
The gearing is not a constant. Gold miners' beta ranged from 1.2 in early 2013 to 2.4 in early 2017; copper miners' from below 0.7 to above 1.6.
Recommendations
- Decision: treat a mining position as three exposures, the metal, the stock market and the company, and decide which of them the mandate wants.
- Sizing: report metal-equivalent exposure (notional × metal beta) and equity beta for every mining position; $100M of gold miners was about $168M of gold.
- Controls: cap company-specific risk explicitly; for gold miners it was about 23% a year in volatility terms, a $23M one-standard-deviation swing on $100M.
- Hedging: a metal hedge on a miner removes at most the metal share of variance (58% for gold miners, 29% for copper miners); hedge the equity beta separately.
- Governance: re-estimate betas quarterly on a rolling two-year window and flag moves outside the historical range.
Limits
- Small baskets: three gold miners, two royalty companies, one silver miner, three copper miners. Broader indices may differ.
- Metal funds are proxies: CPER holds futures and bears roll costs; GLD and SLV carry fees.
- US-listed shares, US-dollar returns, no trading costs or taxes.
- Survivorship: all the companies studied exist today; failed miners are not in the sample.
- Independent research on public data. Not deployed; not investment advice.
How it was built
Sources
Data
- Daily prices and dividends: defeatbeta, "yahoo-finance-data", huggingface.co/datasets/defeatbeta/yahoo-finance-data, ODC-BY; files
stock_pricesandstock_dividend_events, downloaded 1 November 2026 and pinned by sha256.
Methods referenced
- Tufano, P. (1998). "The Determinants of Stock Price Exposure: Financial Engineering and the Gold Mining Industry." Journal of Finance 53(3), 1015–1052.
- Newey, W. K. and West, K. D. (1987). "A Simple, Positive Semi-definite, Heteroskedasticity and Autocorrelation Consistent Covariance Matrix." Econometrica 55(3), 703–708.
Independent research on public data, not investment advice; dollar figures are illustrative. Analysis, code, charts and text were produced with AI assistance and reviewed by the author.