With the 10-year Treasury near 5%, every real estate allocator is asking the same question: how much of the listed real estate book is really a rate bet? REITs are sold as real assets and diversifiers. In 2022 they fell further than the stock market, alongside long bonds.
For a pension, insurer or multi-asset CIO the question is practical. If REITs carry hidden duration, the total-portfolio duration budget is understated, rate stress tests are too small, and the real asset sleeve is not diversifying what the committee thinks it is.
I measured the rate sensitivity of 24 large US REITs across nine sectors on weekly total returns from January 2005 to October 2026, after removing their stock-market risk, and tested whether hedging it with Treasuries would have helped.
Executive summary
The question. How much of a listed real estate allocation is interest-rate risk, and should it be hedged with Treasuries?
The approach. An equal-weight index of 24 REITs (net lease, residential, industrial, towers and data centres, retail, office, healthcare, storage, lodging), weekly total returns including dividends. Each week's return is explained by the S&P 500 and the change in the 10-year Treasury yield; the yield coefficient, expressed in years, is the rate duration REITs carry beyond equity risk. Then two hedges: a walk-forward hedge re-estimated every week from the prior two years only, and a fixed policy hedge set from 2013–2021 data and tested on 2022–2026.
The answer. REITs became bond-like after the financial crisis: about 9 years of rate duration in 2013–2021 and 6 years since 2022, on top of an equity beta near one. Rates explained 10 of the 24.6 points REITs lost in 2022. But the stock market still explains most of the weekly risk, the statistical hedge was at zero going into 2022, and a fixed Treasury hedge is a rate view: it paid in 2022 and cost 3.1 points a year in the decade before.
The decision. Count REIT rate duration in the total-portfolio duration budget and rate stress tests. Do not run a mechanical Treasury hedge on the sleeve. Take the rate view, if any, once, at portfolio level.
Business outcomes
| Decision | What the data showed | What it means |
|---|---|---|
| Report REITs as equity only | 6.1 years of rate duration in 2022–2026; $611k DV01 per $1bn | Total-portfolio duration understated by about $416m of TLT per $1bn of REITs |
| Hedge REIT rate risk with a rolling Treasury hedge | Return 9.2% → 7.1% a year, volatility 25.9% → 26.2% (2007–2026); hedge ratio 0.0 in Q1 2022 | Costs carry, adds no risk reduction, arrives after regime shifts |
| Fix a policy hedge from past data | 2022 loss −24.6% → −9.5%; 2022–2026 return 1.3% → 5.5% a year; same hedge cost 3.1 points a year in 2013–2021 | It is a bet on rising rates, not insurance |
| Tilt by sector | 2022–2026 duration from 9.3 years (towers and data centres) to 4.5 (residential) and about zero (lodging) | Sector mix changes the rate exposure by a factor of two |
Rate duration = minus the coefficient on the weekly change in the 10-year yield (per basis point) × 10,000, after controlling for SPY. Dollar figures per $1bn are illustrative and use the 2022–2026 estimate.
End to end in five steps
| Step | What happens | Output |
|---|---|---|
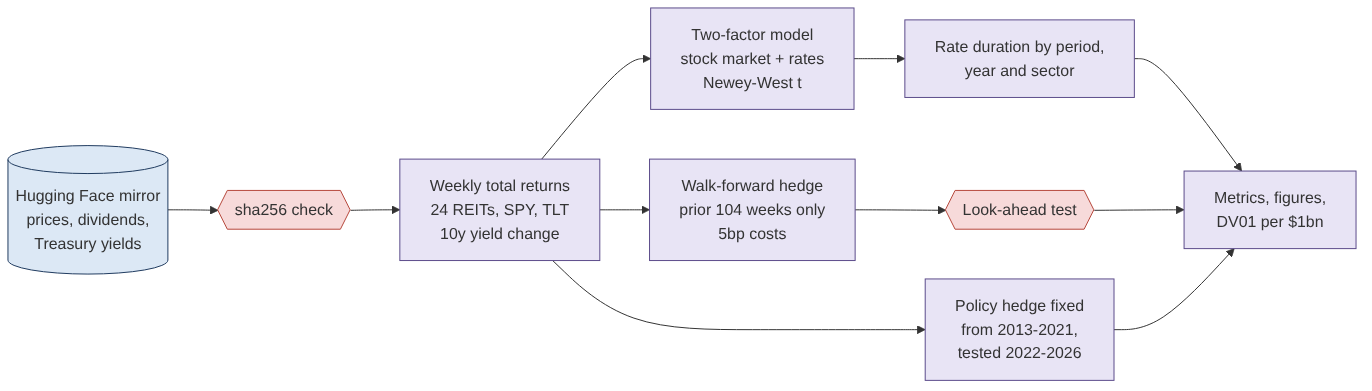
| 1. Source | Daily prices and dividends for 24 REITs, SPY and TLT; daily 10-year Treasury par yield | Checksum-pinned public data |
| 2. Returns | Daily total returns compounded to Friday-to-Friday weeks; equal-weight REIT index; weekly yield change in bp | 1,139 weeks, Jan 2005 – Oct 2026 |
| 3. Two-factor model | REIT return on SPY and the yield change; Newey–West t-statistics | Equity beta and rate duration by period, year and sector |
| 4. Hedges | Walk-forward TLT hedge from the prior 104 weeks only, 5bp costs; policy hedge fixed from 2013–2021 | Out-of-sample return, volatility, drawdown |
| 5. Translate | Duration × $1bn → DV01 and loss per 100bp; 2022 attribution | Numbers a committee can budget |
The data
Twenty-four large US REITs that trade today, chosen to cover every major property type: Realty Income and NNN (net lease); Equity Residential, AvalonBay, Essex, Mid-America and Invitation Homes (residential); Prologis (industrial); American Tower, Crown Castle, Equinix and Digital Realty (towers and data centres); Simon, Kimco, Regency and Federal Realty (retail); Boston Properties, Vornado and Alexandria (office and labs); Welltower and Ventas (healthcare); Public Storage and Extra Space (storage); Host (lodging). Returns include dividends, which are most of a REIT's return. The rate factor is the 10-year constant-maturity Treasury yield.
Because the list is today's large REITs, it carries survivorship bias: average returns are flattered, but the rate sensitivities, which are the subject here, are much less affected.
Results
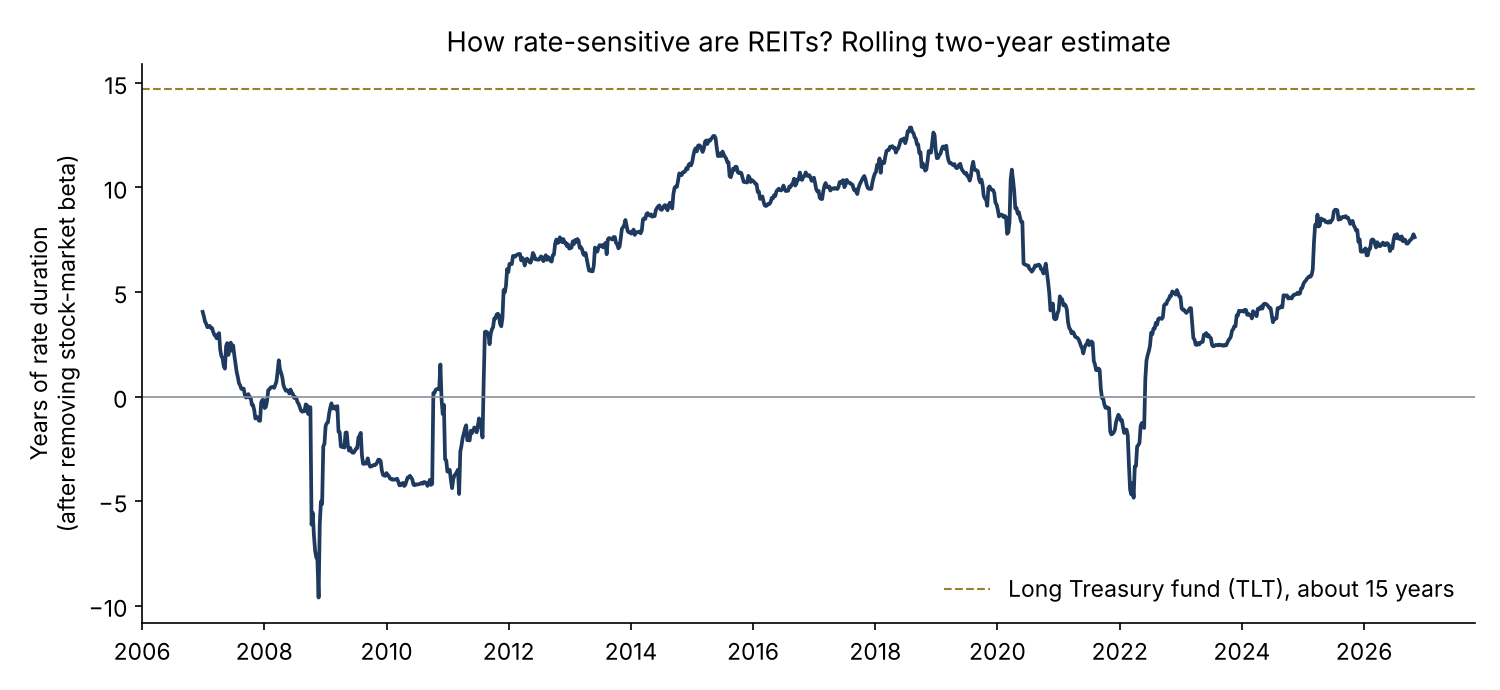
The rate exposure is not a constant. In 2007–2010, when REITs fell with credit markets while yields also fell, the measured duration was negative. From 2012 to 2019, a period of falling and low rates, REITs behaved like 9 to 13-year bonds on top of their equity risk. The 2020 crash, when REITs and yields fell together, pushed the two-year estimate below zero just before rates began to rise.
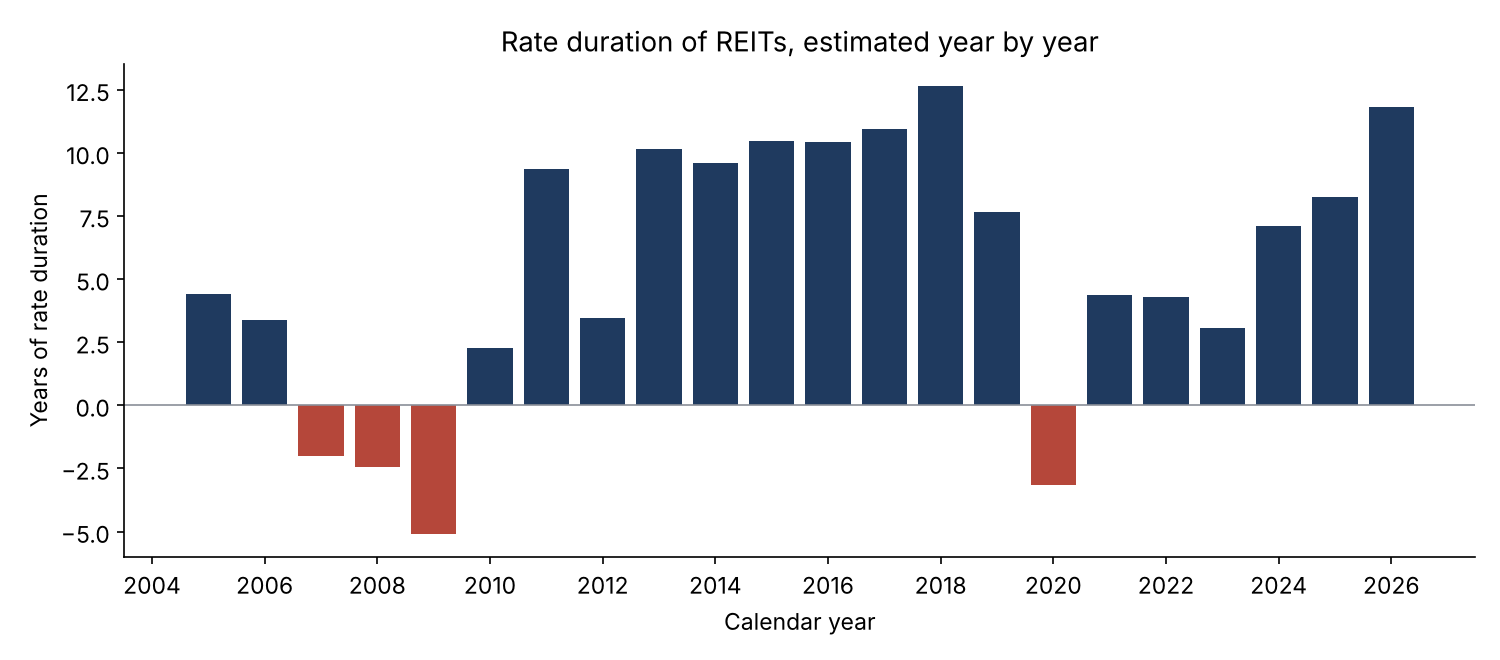
| Period | Equity beta | Rate duration (years) | t-statistic | Weekly variance explained by stock market | Added by rates |
|---|---|---|---|---|---|
| 2005–2026 | 1.08 | 3.7 | −3.5 | 51.7% | +1.5 pts |
| 2005–2012 | 1.18 | 0.3 | −0.1 | 59.9% | +0.0 pts |
| 2013–2021 | 1.09 | 8.7 | −7.9 | 46.1% | +6.9 pts |
| 2022–2026 | 0.72 | 6.1 | −5.1 | 42.7% | +9.1 pts |
Equal-weight index of 24 REITs; weekly total returns; Newey–West (4 lags) t-statistics. A long Treasury fund (TLT) measures 14.7 years on the same method.
Even at its peak, the rate factor adds less than ten percentage points of explained variance. Week to week, REITs are still mostly equities. The rate exposure matters because it is persistent and one-directional in a rate shock, as 2022 showed.
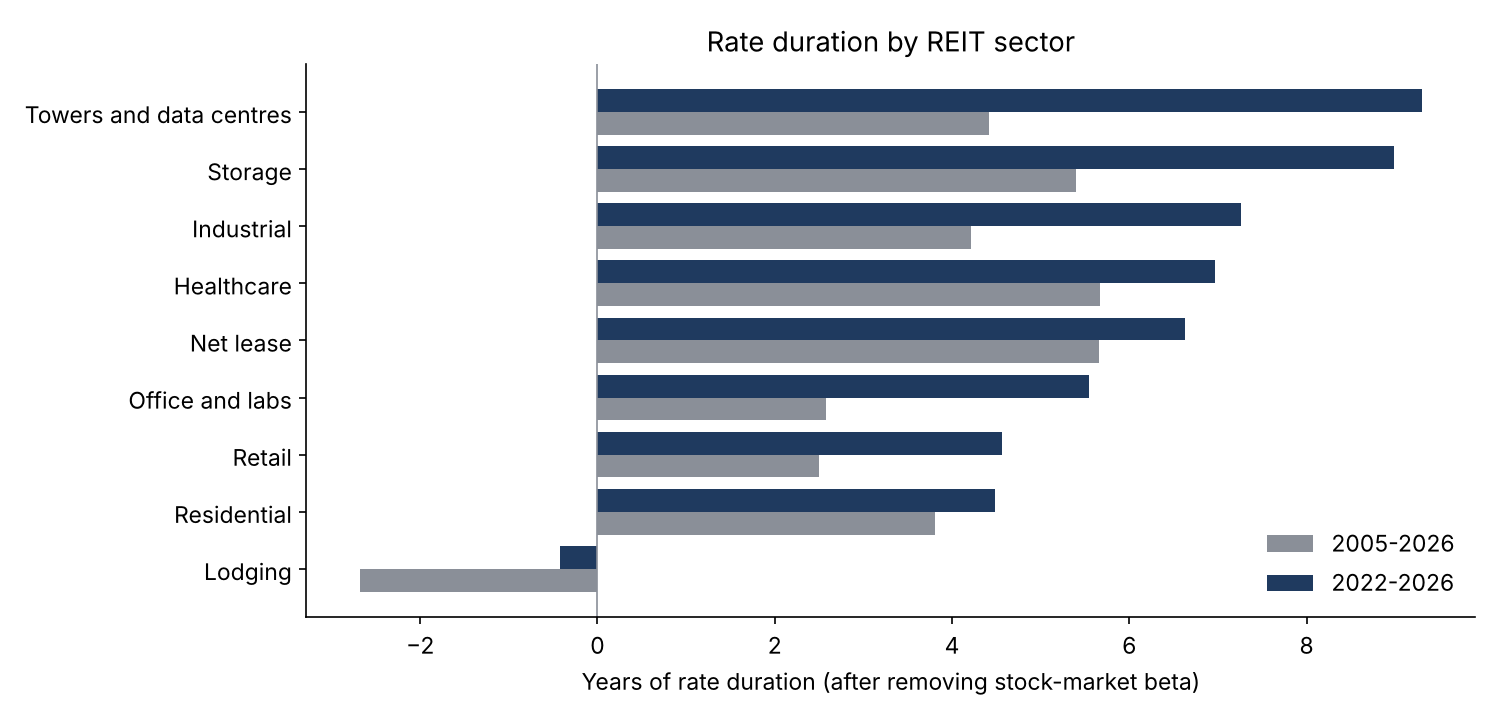
Sectors differ by a factor of two. Since 2022, towers and data centres (9.3 years), storage (9.0) and industrial (7.3) have been the most rate-sensitive; residential (4.5) and retail (4.6) the least, and lodging has none. A committee that wants less rate exposure inside real estate can get it through sector mix without any derivatives.
2022: what the model saw, and what happened
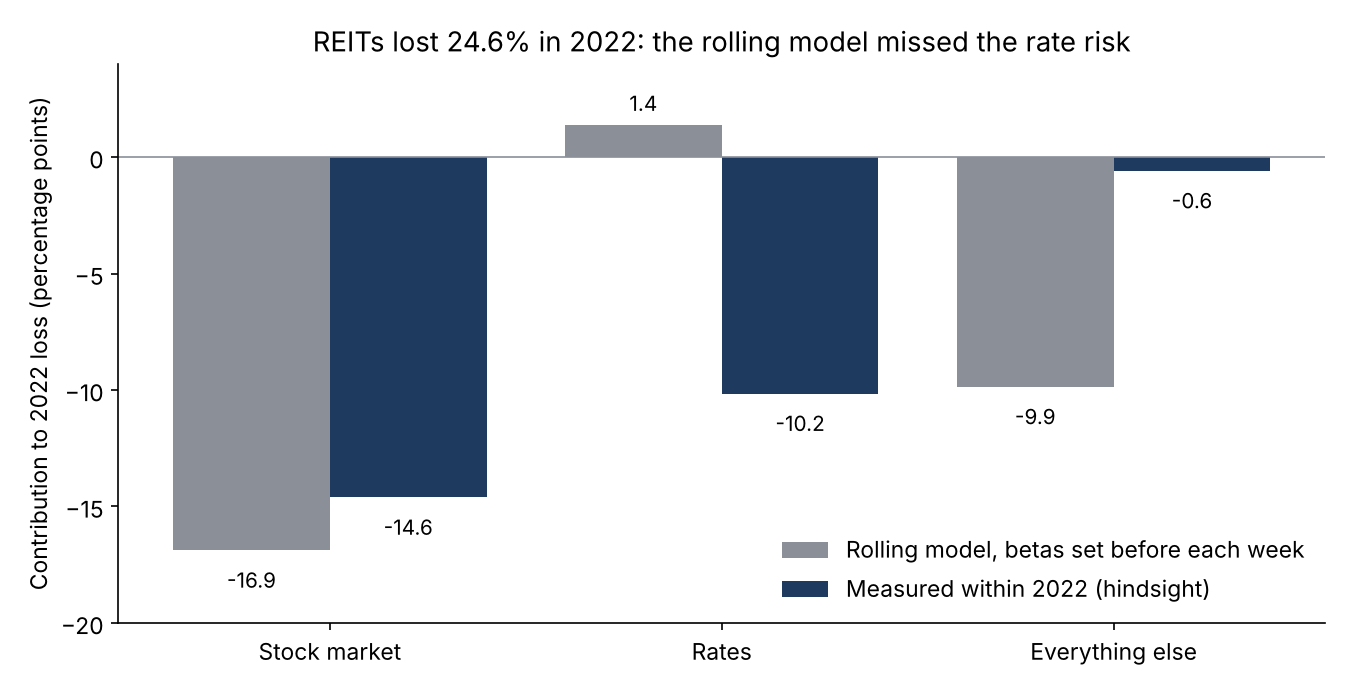
In 2022 the 10-year yield rose 236 basis points. REITs lost 24.6%, against −18.2% for the S&P 500 and −31.2% for long Treasuries. Measured within the year, the stock market explains 14.6 points of the loss and rates 10.2. But a rolling model estimated before each week, the kind a risk system runs, attributed a small gain to rates: its two-year window was dominated by the 2020 crash, when REITs and yields fell together. Its hedge ratio was zero in the first quarter of 2022 and reached 0.3 only by year end.
Does hedging with Treasuries help?
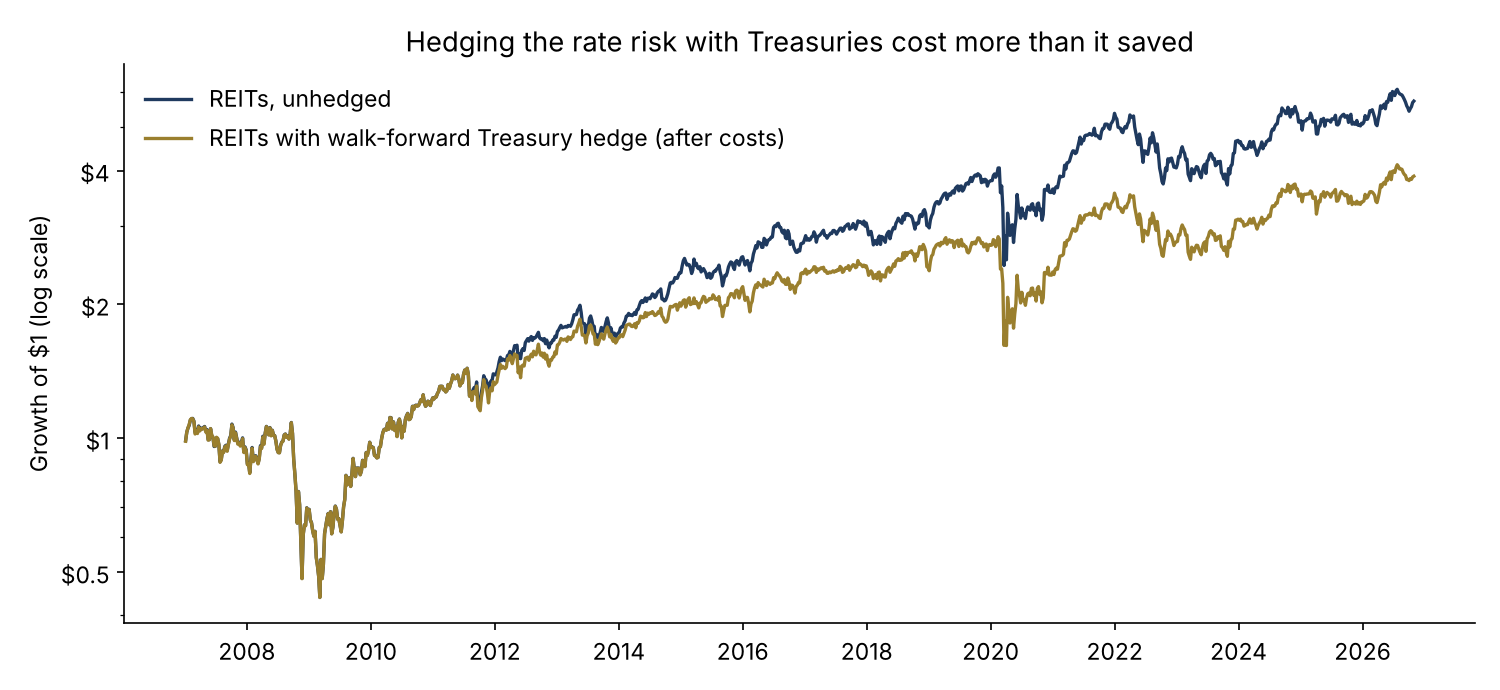
| Strategy | Period | Annual return | Volatility | Worst drawdown |
|---|---|---|---|---|
| Unhedged REITs | 2007–2026 | 9.2% | 25.9% | −60.4% |
| Walk-forward Treasury hedge | 2007–2026 | 7.1% | 26.2% | −60.4% |
| Unhedged REITs | 2022–2026 | 1.3% | 19.2% | −30.4% |
| Policy hedge 0.51 (set from 2013–2021) | 2022–2026 | 5.5% | 17.9% | −25.5% |
| Unhedged REITs | 2013–2021 | 13.7% | 22.6% | −39.7% |
| Same policy hedge, applied to 2013–2021 | 2013–2021 | 10.6% | 23.2% | −43.2% |
The policy hedge shorts $0.51 of TLT per $1 of REITs; the ratio is the 2013–2021 REIT rate sensitivity divided by TLT's. The 2013–2021 line uses the ratio inside its own estimation period and is shown only to show the hedge's cost when rates fall.
The walk-forward hedge does what statistical hedges do in a regime change: it learns after the event. It cost 2.1 points a year and did not lower volatility. A fixed hedge set from 2013–2021 data would have cut the 2022 loss from 24.6% to 9.5%, but the same hedge cost 3.1 points a year in 2013–2021 and raised volatility. Shorting Treasuries against REITs is a view that rates will rise, not a hedge that pays in all states.
The commercial case
The product a client would pay for is a real-asset rate-exposure monitor: rolling and regime-aware rate duration for each real estate or infrastructure sleeve and sector, expressed as DV01 in dollars and fed into the total-portfolio duration budget and stress tests.
| Element | What it is | Basis |
|---|---|---|
| Who pays | Pension, insurance and endowment CIOs and risk teams with listed real estate sleeves; multi-asset PMs; real-asset risk teams at asset managers | Budget holders: CIO, head of risk, head of real assets |
| The problem in dollars | A $1bn REIT sleeve carries about $611k of DV01, $61m per 100bp, outside the bond duration report | This study's 2022–2026 estimate (illustrative) |
| The product | Sleeve and sector rate duration with ranges by regime, DV01 in dollars, stress losses, sector-mix what-ifs | This repository is the working prototype |
| Proof | 22 years of weekly data, walk-forward test, out-of-sample policy test | Public code and data |
| Build vs buy | 3–4 weeks to connect to a client's holdings; today most factor models report REITs as equity beta only | Illustrative effort |
| Pricing logic | $50–100k a year per client: under 0.2% of a single 100bp shock on $1bn | Illustrative |
| What could stop adoption | Rate sensitivity changes by regime | Report ranges and regime flags, not one number |
| How a client judges it | Total-portfolio duration matches realised rate sensitivity in rate shocks | Reviewed after each major rate move |
All prices and effort figures are illustrative assumptions with their arithmetic shown. Value figures come from this project's results; they are not a forecast for any firm.
Recommendations
- Put REITs in the duration budget. Carry the sleeve at 6 years of rate duration (the 2022–2026 estimate), with a range of 4 to 9 years by regime, in total-portfolio duration and rate stress tests.
- Do not run a mechanical Treasury hedge on the sleeve. It cost 2.1 points a year, did not reduce volatility, and was at zero when 2022 began.
- Set the rate view once, at portfolio level. If the committee wants less duration, cut it in the bond book, where it is cheap and transparent, rather than shorting Treasuries inside real estate.
- Use sector mix as the lever inside real estate. Towers, storage and industrial carry roughly twice the rate duration of residential and retail.
- Monitor the regime. Re-estimate quarterly and flag when the rolling estimate and the long-run estimate diverge, as they did going into 2022.
Limits
- Survivorship. Today's large REITs; average returns are flattered, sensitivities much less so.
- Equal weight. An index fund weights by market value and has more towers, industrial and data centres, which would raise the measured duration.
- One rate factor. The 10-year yield combines real rates, inflation expectations and term premium; credit spreads are not modelled separately.
- Regime dependence. Estimates moved from negative to 13 years; any single number should be read as a range.
- Not a recommendation. Independent research on public data. It has not been deployed and is not investment advice.
How it was built
Sources
Data
- Daily prices and dividends for the 24 REITs listed above, SPY and TLT, and the daily US Treasury par yield curve: via huggingface.co/datasets/defeatbeta/yahoo-finance-data (ODC-BY), downloaded 1 November 2026.
Methods referenced
- Sweeney, R. J. and Warga, A. D. (1986). "The Pricing of Interest-Rate Risk: Evidence from the Stock Market." Journal of Finance 41(2), 393–410.
- Newey, W. K. and West, K. D. (1987). "A Simple, Positive Semi-Definite, Heteroskedasticity and Autocorrelation Consistent Covariance Matrix." Econometrica 55(3), 703–708.
Independent research on public data, not investment advice; dollar figures are illustrative. Analysis, code, charts and text were produced with AI assistance and reviewed by the author.