Steel is the commodity most exposed to trade policy. Since 2018 the US has used Section 232 of the Trade Expansion Act to put a 25% tariff on imported steel, removed and restored country exemptions, and in 2025 doubled the rate to 50%. Each announcement moved steel equities sharply.
For a portfolio manager, a metals desk or an industrial credit committee, the question is practical. When a tariff is announced, how much of the effect is priced immediately, is there anything left to earn afterwards, and does protection translate into lasting shareholder value?
I tested four tariff events on daily total returns for five US steel companies and five foreign steelmakers listed in New York, using a standard event-study design with each stock's own market sensitivity estimated before the event.
Executive summary
The question. Do Section 232 steel tariffs create value for steel shareholders, and is any of it left to capture after the announcement?
The approach. Four events: the 25% tariff announced on 1 March 2018; the signing on 8 March 2018 with Canada and Mexico exempted; the restoration of 25% for all countries on 10 February 2025; and the doubling to 50% announced after the close on 30 May 2025 (first trading day 2 June). For each stock, a market model on the S&P 500 estimated over trading days −260 to −21, then abnormal returns around each event and buy-and-hold returns against the S&P 500 for up to a year and beyond.
The answer. The market priced each announcement within two days, and only for US producers. Abnormal returns from day 2 to day 20 were small and statistically indistinguishable from zero. In 2018 the first-day gain had disappeared within six months and US steel trailed the S&P 500 by 20 points by November 2019. Since February 2025 US steel has done far better, but foreign steelmakers also beat the index, so most of the long-run return reflects the steel cycle rather than the tariff alone.
The decision. Treat a tariff announcement as a two-day repricing, not a trend. Do not add steel exposure after day one on policy news, size stress tests to the measured jumps, and isolate tariff exposure with a US-versus-foreign pair if that is the view.
Business outcomes
| Decision | What the data showed | What it means |
|---|---|---|
| Buy US steel at the close after an announcement | Days 2–20 abnormal return: −5.8%, +2.8%, +2.3%; none significant | No edge from chasing; the move happens on day 0–1 |
| Hold US steel for a year after the 2018 announcement | −1.9% vs the S&P 500; −19.7% by Nov 2019 | Protection did not become shareholder value that cycle |
| Hold US steel since the Feb 2025 restoration | +41.8 points vs the S&P 500 to Oct 2026; foreign steel +18.8 | Strong, but partly the global steel cycle |
| Stress-test a US steel position for a policy shock | Two-day jumps of 5–11% on average; up to +27% for Cleveland-Cliffs | Event risk is large, fast and two-sided (−6.6% on the 2018 signing) |
Abnormal returns from a market model on the S&P 500 (SPY), estimated over trading days −260 to −21. Long horizons are equal-weight buy-and-hold returns minus SPY, dividends included.
End to end in five steps
| Step | What happens | Output |
|---|---|---|
| 1. Source | Daily prices and dividends for 10 steel stocks, SPY and a base-metals fund; event dates from the proclamations and announcements | Checksum-pinned public data |
| 2. Returns | Daily total return including dividends | Panel from 1995 to Oct 2026 |
| 3. Market model | Each stock regressed on SPY over days −260 to −21 before each event | Alpha, beta and residual volatility |
| 4. Abnormal returns | Actual minus expected return around day 0; cumulative over 0–1, −1 to +3, 2–20 and 0–10 days; Brown–Warner t-statistics | CARs by stock and group |
| 5. Long run | Equal-weight buy-and-hold returns minus SPY at 63, 126 and 250 days, and to the end of the data | Did the gain last? |
The data and the events
The US group is Nucor, Steel Dynamics and Commercial Metals (electric-arc-furnace producers that melt scrap), Cleveland-Cliffs (integrated, iron-ore based) and Reliance (the largest service-centre distributor). The foreign group is ArcelorMittal, Ternium, Gerdau, CSN and POSCO, all listed in New York. US Steel is excluded because the Nippon Steel takeover dominated its price through 2024–25 and it delisted in June 2025.
Day 0 is the first session in which the news could be priced. The 30 May 2025 doubling was announced at a Pennsylvania steelworks after the market had closed, so day 0 is Monday 2 June. As a robustness check, every result was rerun with a two-factor model that also controls for base-metal prices; the conclusions do not change.
What happened on the day
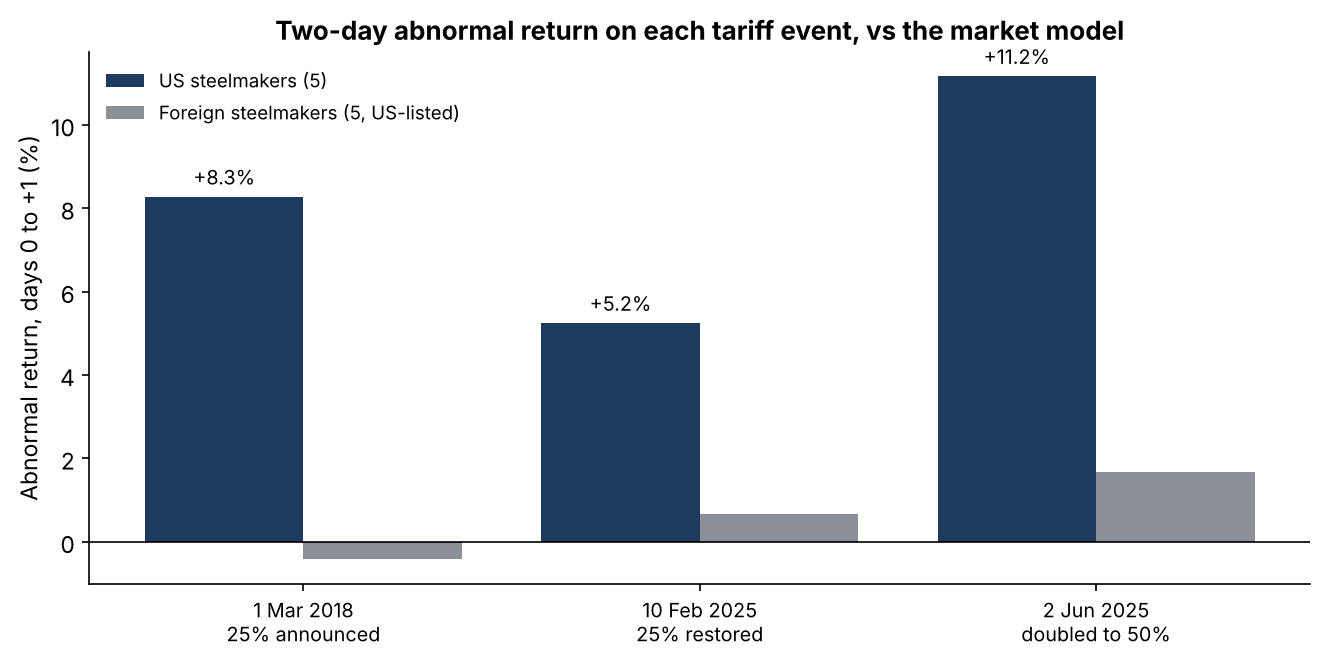
| Event | US steelmakers, days 0–1 | t | Foreign steelmakers, days 0–1 | US, days 2–20 |
|---|---|---|---|---|
| 1 Mar 2018, 25% announced | +8.3% | 6.5 | −0.4% | −5.8% |
| 8 Mar 2018, signed with exemptions | −6.6% | −5.2 | −5.3% | +0.1% |
| 10 Feb 2025, 25% restored for all | +5.2% | 4.1 | +0.7% | +2.8% |
| 2 Jun 2025, doubled to 50% | +11.2% | 8.1 | +1.7% | +2.3% |
Equal-weight averages of five stocks per group. Group t-statistics assume independent residuals and overstate significance when stocks move together; every individual US stock was positive on all three announcements except Commercial Metals in Feb 2025.
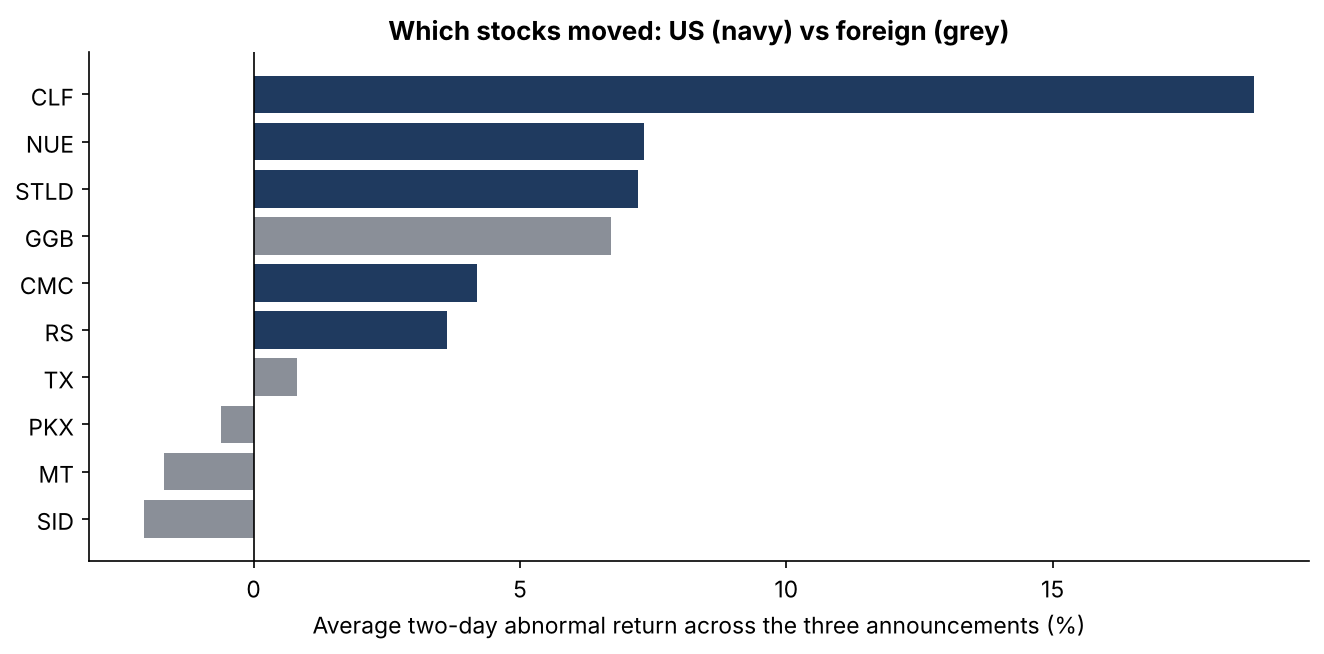
The reaction was concentrated where the economics are. Cleveland-Cliffs, the most domestically exposed integrated producer, gained 16%, 13% and 27% beyond the market on the three announcements. Among foreign names, only Gerdau, which owns substantial US mills, moved with the US group.
Did the gain last?
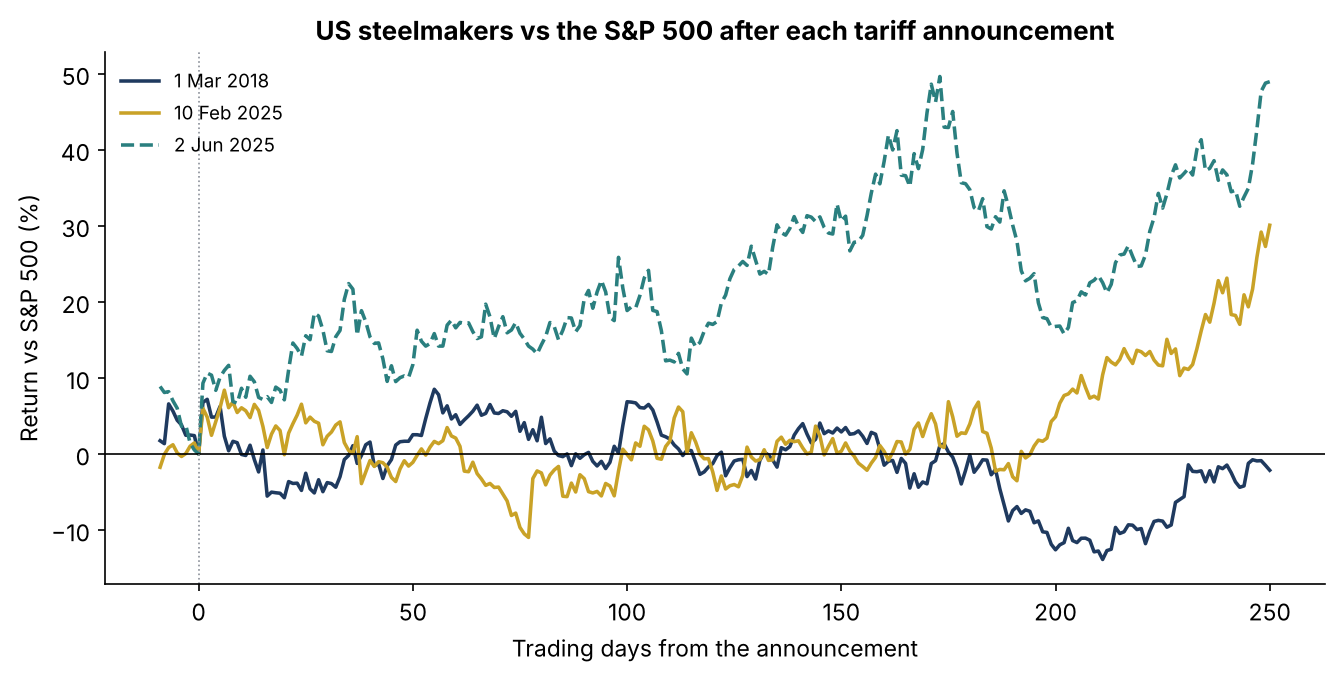
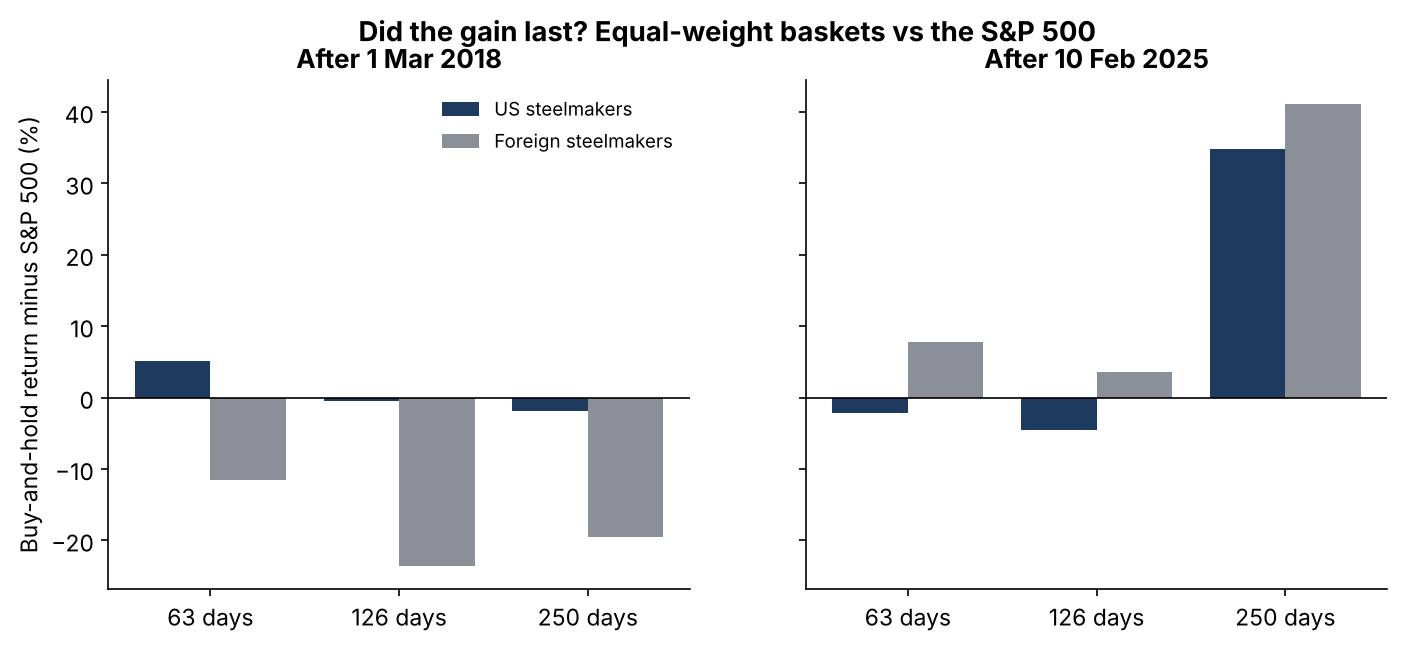
The two tariff regimes ended very differently. After March 2018, the US basket was 5.1 points ahead of the S&P 500 at three months, flat at six and 1.9 points behind at a year, and 19.7 points behind by November 2019. Foreign steel fared worse, so a US-versus-foreign pair did keep a gap: the tariff's relative effect lasted even though the absolute gain did not.
After February 2025, US steel was briefly behind the index, then rallied: 34.8 points ahead at one year and 41.8 points ahead by October 2026. But foreign steel was 41.2 points ahead at one year as well. Much of the 2025–26 gain came from the global steel and metals cycle, not from US protection alone.
The commercial case
The product a client would pay for is a policy-event risk monitor for metals and industrial portfolios. For each name it estimates the size and direction of the price shock from a defined policy event, flags when a position's exposure is outright beta rather than the intended policy view, and keeps an event calendar with measured historical responses.
| Element | What it is | Basis |
|---|---|---|
| Who pays | Metals and commodity trading desks, industrial and materials portfolio managers, credit committees lending to steel producers or steel users, risk teams | Budget holders: head of risk, desk heads, sector PMs |
| The problem in dollars | A two-day policy shock of 5–11% on steel equities is $50–110M on a $1bn steel book; the 2018 signing reversed 6.6% in a day | This study's results (illustrative) |
| The product | Event calendar, per-name shock estimates with uncertainty, stress scenarios, beta-vs-policy exposure split | This repository is the working prototype |
| Proof | Four events, ten stocks, pre-event estimation, robustness to a metals factor | Public code and data |
| Build vs buy | 3–4 weeks to extend to a client's universe and event set | Illustrative effort |
| Pricing logic | $60–120k a year per desk, a small fraction of one avoided shock on a $1bn book | Illustrative |
| What could stop adoption | Few events; each new policy differs | Present shocks as ranges, not forecasts |
| How a client judges it | Stress losses matched to realised moves; trades not added after day one | Reported per event |
All prices and effort figures are illustrative assumptions with their arithmetic shown. Value figures come from this project's results; they are not a forecast for any firm.
Recommendations
- Treat tariff headlines as a two-day repricing. The measured edge after day one was zero; do not add steel exposure on policy news after the first session.
- Stress for jumps, both ways. Use the measured 5–11% basket moves, and up to 27% for the most domestic names, in scenario analysis for steel holdings, suppliers and steel-consuming borrowers.
- Expect reversals. Exemptions and implementation details can take back much of the gain within days, as on 8 March 2018.
- Separate the policy view from steel beta. If the thesis is about US protection, hold it as US versus foreign producers; the outright position is mostly a bet on the steel cycle.
- Judge outcomes over the cycle. The same policy produced a loss versus the market after 2018 and a large gain after 2025; the difference was global steel demand and prices.
Limits
- Four events. Each policy differed in scope and context; the averages describe these events, not tariffs in general.
- Overlapping news. In 2025 tariff headlines on many goods ran together, and the market model cannot separate them.
- Ten stocks. Group t-statistics treat residuals as independent and overstate significance when steel stocks move together.
- Listed equities only. Steel prices and producer margins were not available for this run.
- Not a recommendation. Independent research on public data. It has not been deployed and is not investment advice.
How it was built

Sources
Data
- Daily prices and dividends for NUE, STLD, CMC, CLF, RS, MT, TX, GGB, SID, PKX, SPY and DBB: via huggingface.co/datasets/defeatbeta/yahoo-finance-data (ODC-BY).
- Event dates: Presidential Proclamation 9705, "Adjusting Imports of Steel Into the United States" (8 March 2018), and the 1 March 2018 announcement; the proclamation of 10 February 2025 restoring the 25% tariff for all countries; the 30 May 2025 announcement and 3 June 2025 proclamation raising the rate to 50% from 4 June 2025, as summarised by Holland & Knight and White & Case.
Methods referenced
- Fama, E. F., Fisher, L., Jensen, M. C. and Roll, R. (1969). "The Adjustment of Stock Prices to New Information." International Economic Review 10(1), 1–21.
- Brown, S. J. and Warner, J. B. (1985). "Using Daily Stock Returns: The Case of Event Studies." Journal of Financial Economics 14(1), 3–31.
- MacKinlay, A. C. (1997). "Event Studies in Economics and Finance." Journal of Economic Literature 35(1), 13–39.
- Barber, B. M. and Lyon, J. D. (1997). "Detecting Long-Run Abnormal Stock Returns." Journal of Financial Economics 43(3), 341–372.
Independent research on public data, not investment advice; dollar figures are illustrative. Analysis, code, charts and text were produced with AI assistance and reviewed by the author.