Every portfolio has a crisis plan, and most of them lean on a short list of safe havens: the Japanese yen, the Swiss franc, the US dollar, gold and long Treasuries. The assumption is that when stocks fall hard, money runs to these assets and their prices rise.
For a CIO or a risk committee, the question is practical. Which of these actually paid when it mattered, does it still work, and what does it cost to hold the insurance when nothing is going wrong?
I tested nine candidate havens on weekly total returns from March 2007 to October 2026, using exchange-traded funds that hold each currency, gold or Treasuries, against the S&P 500.
Executive summary
The question. Which safe-haven assets protect a US equity portfolio in sell-offs, how reliable are they, and at what cost?
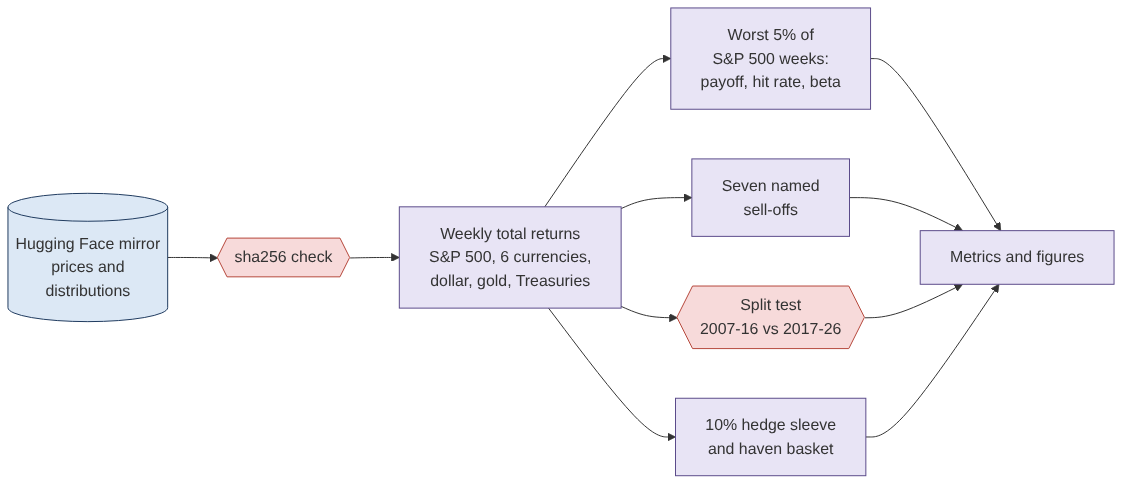
The approach. Weekly total returns, March 2007 to October 2026 (1,027 weeks), for the S&P 500 (SPY), six currencies against the dollar (yen, franc, euro, pound, Australian and Canadian dollar, via the Invesco CurrencyShares funds), the dollar index (UUP), gold (GLD) and long Treasuries (TLT). Three tests: what each paid in the S&P 500's worst 5% of weeks; what each did in seven named sell-offs from 2008 to 2025; and whether the payoff held up in the second decade.
The answer. Long Treasuries, the yen and the dollar paid in the worst weeks; the franc and gold were roughly flat; the commodity currencies fell with stocks. But every haven failed at least once. The yen and Treasuries lost alongside stocks in 2022, when inflation drove both sell-offs; the dollar fell in the 2025 tariff shock. The yen's average payoff in bad weeks dropped from 1.1% to 0.2% after 2016, and holding it cost 1.9% a year.
The decision. Do not rely on one haven. Match the hedge to the kind of shock (a growth scare versus an inflation or rate shock), hold a small basket rather than a single asset, and review it against the last two years, not the last crisis.
Business outcomes
| Decision | What the data showed | What it means |
|---|---|---|
| Use the yen as the crisis hedge | +1.0% in the worst weeks, but +0.2% since 2017, −21.9% in 2022 and −1.9% a year to hold | Its insurance faded and was expensive |
| Use long Treasuries | +1.5% in the worst weeks (77% up), +31.0% in 2011, but −31.2% in 2022 | Strong in growth scares, worst in rate shocks |
| Use the US dollar | +0.8% (69% up), +18.8% in 2022, but −3.2% in the 2025 tariff shock | The best 2022 hedge, not reliable when the shock is US-made |
| Hold a basket of dollar, Treasuries, yen and gold | +0.75% in the worst weeks, up 79% of the time; rose in 6 of 7 sell-offs; 6.8% volatility | More reliable than any one haven |
| Rely on the franc or gold | −0.25% and −0.26% in the worst weeks | Not hedges week to week, even if gold paid in some crises |
Worst weeks = the 52 weeks (5%) with the lowest S&P 500 total return, March 2007 to October 2026. All returns include distributions. Currency funds are long the foreign currency against the US dollar.
End to end in five steps
| Step | What happens | Output |
|---|---|---|
| 1. Source | Daily prices and distributions for SPY, six currency funds, UUP, GLD and TLT | Checksum-pinned public data |
| 2. Returns | Daily total returns, compounded to Friday-to-Friday weeks | 1,027 weeks, Mar 2007 – Oct 2026 |
| 3. Tail weeks | Each haven's average return and hit rate in the S&P 500's worst 5% of weeks; up and down betas | Which assets actually paid |
| 4. Sell-offs and stability | Seven named sell-offs from daily data; the tail test split at 2016 | Did it work every time, and does it still? |
| 5. Cost and sizing | Annual return, volatility and drawdown of each haven; a 10% hedge sleeve | What the insurance costs |
The data
Each currency fund holds deposits in that currency and so moves with its exchange rate against the dollar, plus the interest it earns. The dollar index fund (UUP) is long the dollar against a basket of major currencies. Gold and Treasuries are the two non-currency havens most portfolios hold. All returns include distributions. The sell-off windows are measured from the S&P 500's peak to its trough on daily data.
What paid when stocks fell hardest
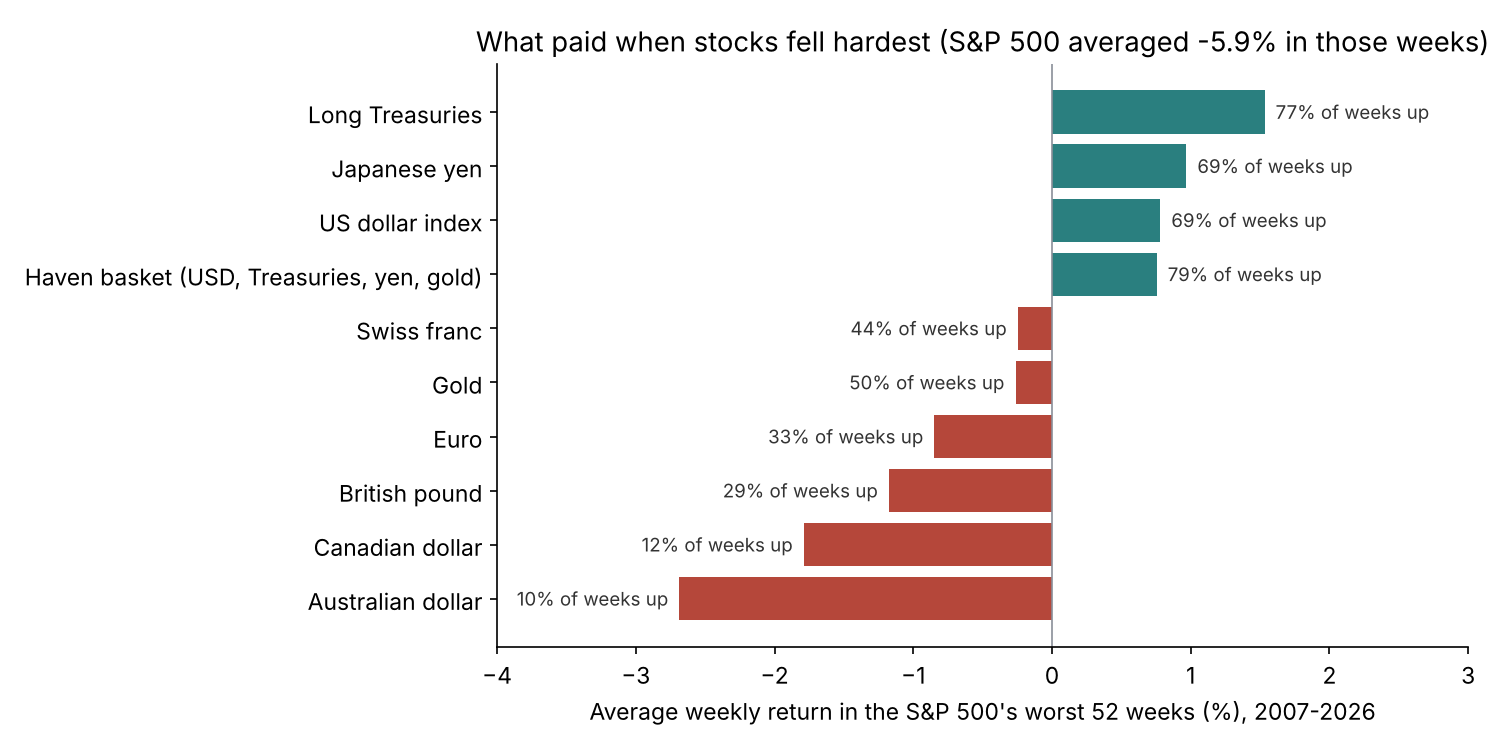
Three assets paid on average: long Treasuries (+1.5%, up in 77% of the worst weeks), the yen (+1.0%, 69%) and the dollar (+0.8%, 69%). The franc and gold were roughly flat. The Australian and Canadian dollars fell in almost nine of ten of those weeks: they are risk assets, tied to commodities and growth.
Did it work every time?
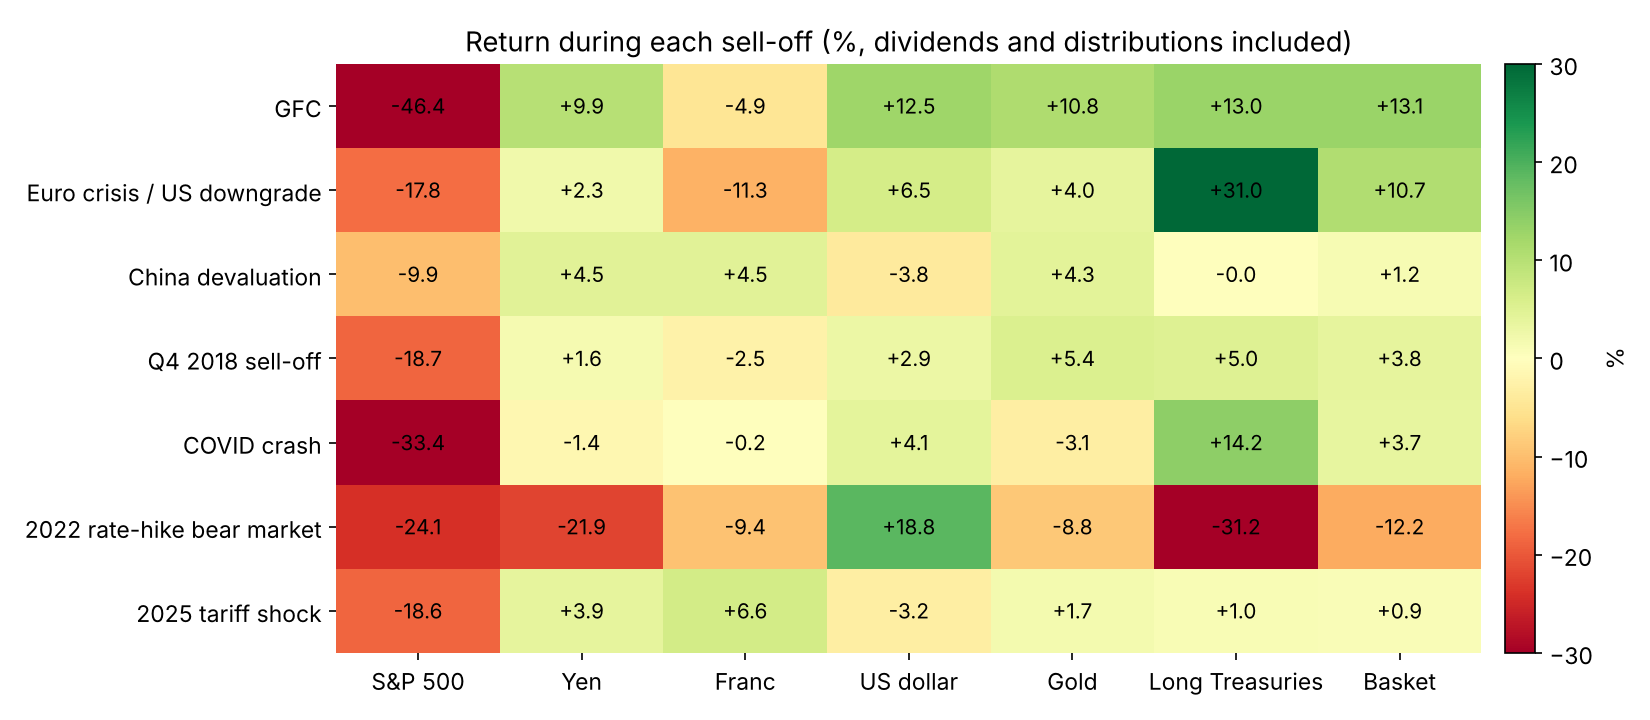
No single haven rose in all seven sell-offs. The yen gained in five, but lost 21.9% in 2022. Long Treasuries gained 31.0% in the 2011 euro crisis and 14.2% in the COVID crash, then lost 31.2% in 2022, when the same force, rising inflation and interest rates, drove stocks and bonds down together. The dollar gained 18.8% in 2022 and fell 3.2% in the 2025 tariff shock, a sell-off that started in the US. An equal-weight basket of the dollar, Treasuries, the yen and gold rose in six of the seven and lost 12.2% in 2022, half of what stocks lost.
Does it still work?
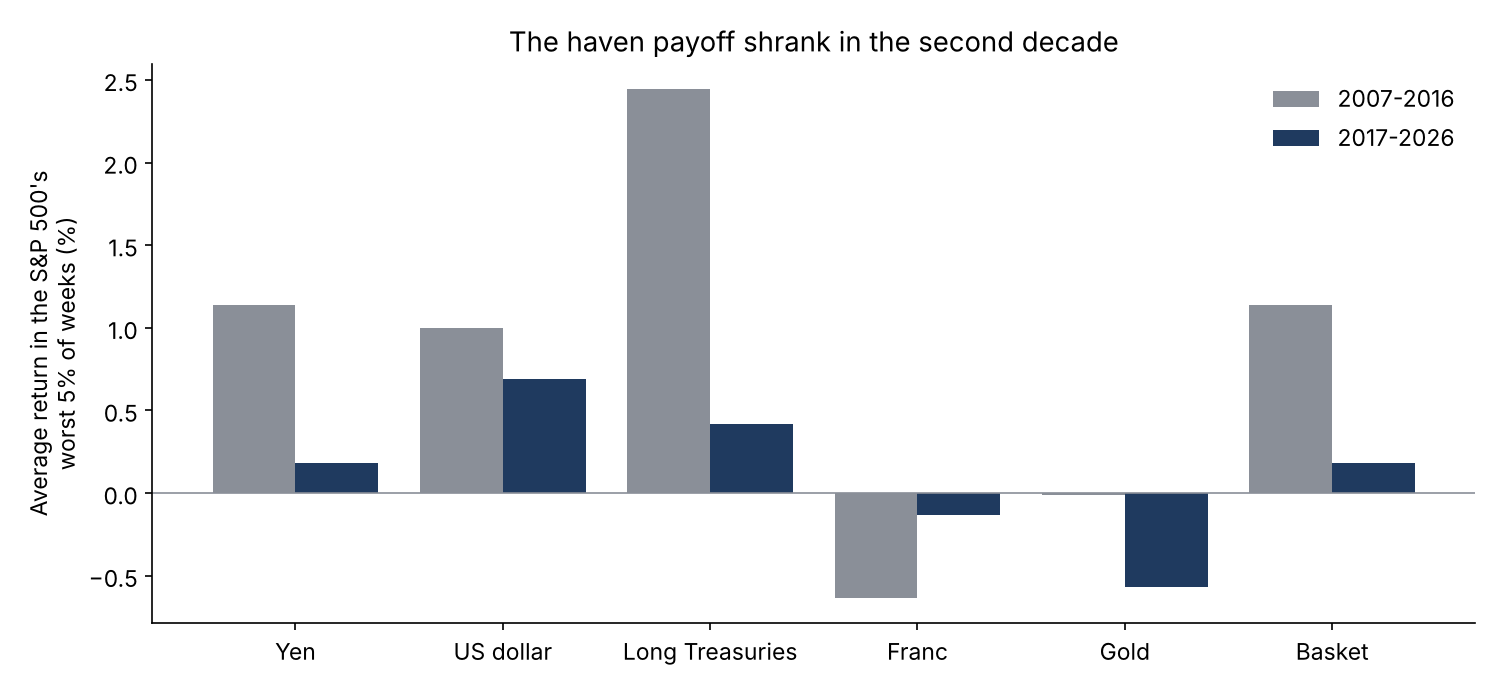
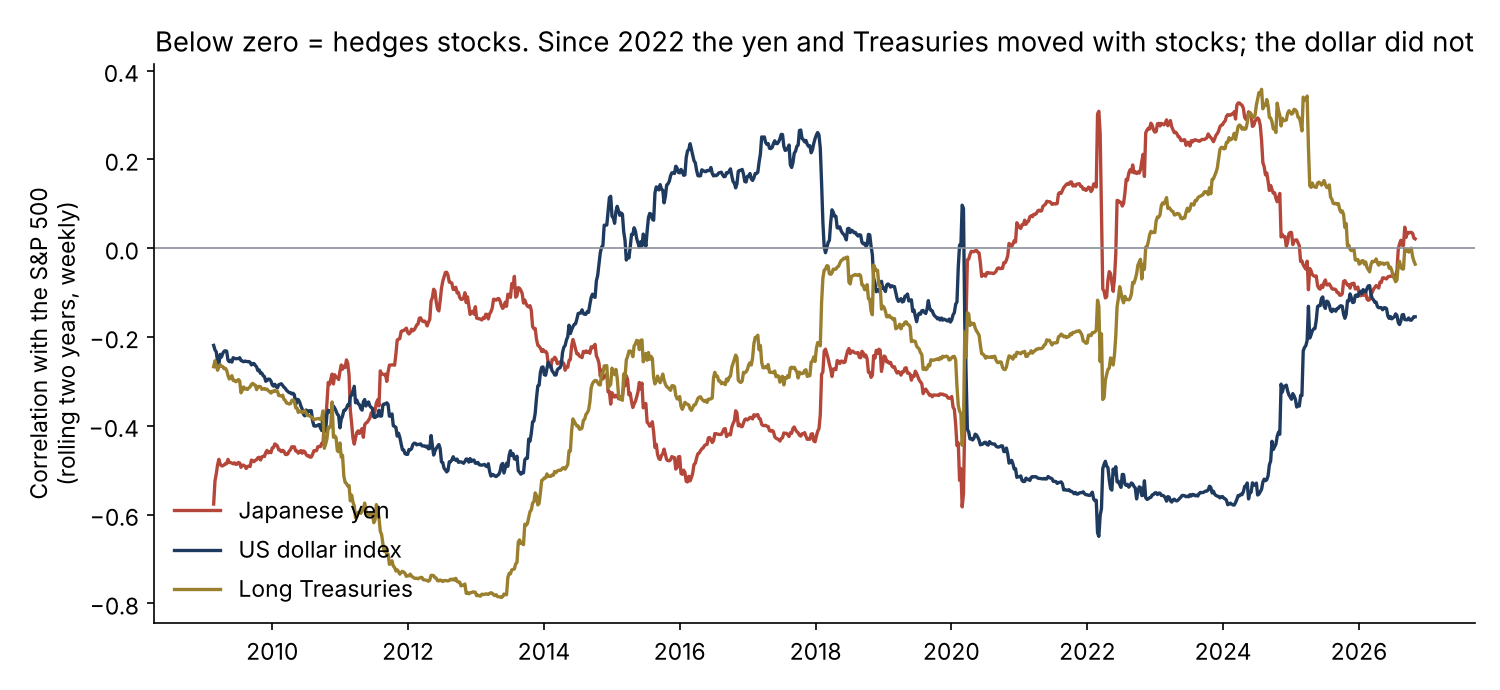
The haven payoff shrank in the second decade. In the S&P 500's worst weeks the yen averaged +1.1% in 2007–2016 and +0.2% in 2017–2026; long Treasuries +2.4% and +0.4%. The dollar held up best, +1.0% and +0.7%. The correlation chart shows why: from 2022 the yen and Treasuries moved with stocks for long stretches, while the dollar became the more dependable hedge.
What the insurance costs
| Asset | Annual return | Volatility | Worst drawdown | S&P 500 + 10% of it: annual return | Worst drawdown |
|---|---|---|---|---|---|
| S&P 500 alone | 10.9% | 18.1% | −54.6% | – | – |
| Yen | −1.9% | 9.8% | −56.9% | 9.8% | −49.4% |
| US dollar index | +1.8% | 7.6% | −21.7% | 10.2% | −49.9% |
| Long Treasuries | +2.7% | 14.2% | −47.8% | 10.4% | −49.2% |
| Gold | +8.9% | 17.1% | −44.7% | 11.0% | −49.1% |
| Haven basket | +3.4% | 6.8% | −20.2% | 10.3% | −49.4% |
Weekly total returns, March 2007 to October 2026. The 10% sleeve is rebalanced weekly; costs are not deducted.
Holding the yen lost 1.9% a year, and the fund's worst drawdown was larger than the S&P 500's. A 10% hedge sleeve trimmed the portfolio's worst drawdown by about five points whichever haven filled it, so the choice of haven matters less for the worst case than for what it costs in the years in between.
The commercial case
The product a client would pay for is a crisis-hedge scorecard: for each hedge a portfolio relies on, its measured payoff in the worst weeks, its hit rate, its behaviour in growth shocks versus rate shocks, its rolling correlation and its carrying cost, refreshed monthly and flagged when a hedge stops working.
| Element | What it is | Basis |
|---|---|---|
| Who pays | CIOs, heads of risk and multi-asset PMs at pensions, insurers, endowments and family offices; macro and risk-mitigation teams at asset managers | Budget holders: CIO, head of risk |
| The problem in dollars | In the worst weeks the S&P 500 averaged −5.9%, $59M on $1bn; a yen hedge sleeve cost about $11M a year in return versus a basket's $6M | This study's results (illustrative) |
| The product | Hedge scorecard, regime stress tests, quarterly review pack | This repository is the working prototype |
| Proof | Nineteen years, seven sell-offs, a split test across decades | Public code and data |
| Build vs buy | 3–4 weeks to connect to a client's hedges and holdings | Illustrative effort |
| Pricing logic | $40–80k a year per client, below a year's cost difference between hedges on $1bn | Illustrative |
| What could stop adoption | Few crises; each is different | Present ranges and hit rates, not promises |
| How a client judges it | Hedge payoff in the next drawdown versus the scorecard's ranking | Reviewed after each sell-off |
All prices and effort figures are illustrative assumptions with their arithmetic shown. Value figures come from this project's results; they are not a forecast for any firm.
Recommendations
- Hold a basket, not one haven. An equal-weight mix of the dollar, Treasuries, the yen and gold rose in six of seven sell-offs and in 79% of the worst weeks.
- Stress for two kinds of shock. Growth scares favoured Treasuries and the yen; the 2022 inflation shock favoured only the dollar.
- Watch the carrying cost. The yen cost 1.9% a year to hold; insurance that bleeds that much needs to pay reliably, and since 2017 it has not.
- Do not count the franc, gold or commodity currencies as weekly hedges. Gold paid in some crises but was flat in the worst weeks on average.
- Review on recent evidence. Re-run the scorecard quarterly on the last two years; the havens of 2008 were not the havens of 2022.
Limits
- Few events. Seven sell-offs and 52 worst weeks; hit rates carry wide uncertainty.
- Fund returns, not spot rates. Currency funds include their deposit interest and fees, so they show what an investor actually earned.
- US-dollar investor. A yen-based or euro-based investor would see these hedges differently.
- No transaction costs in the 10% sleeve.
- Not a recommendation. Independent research on public data. It has not been deployed and is not investment advice.
How it was built
Sources
Data
- Daily prices and distributions for SPY, FXY, FXF, FXE, FXB, FXA, FXC, UUP, GLD and TLT: via huggingface.co/datasets/defeatbeta/yahoo-finance-data (ODC-BY), downloaded 1 November 2026.
Methods referenced
- Ranaldo, A. and Söderlind, P. (2010). "Safe Haven Currencies." Review of Finance 14(3), 385–407.
- Baur, D. G. and Lucey, B. M. (2010). "Is Gold a Hedge or a Safe Haven? An Analysis of Stocks, Bonds and Gold." Financial Review 45(2), 217–229.
Independent research on public data, not investment advice; dollar figures are illustrative. Analysis, code, charts and text were produced with AI assistance and reviewed by the author.