Private credit has no screen price. A direct loan is valued by the manager that made it, once a quarter, using models and comparables, and the result reaches investors as a net asset value (NAV) some six weeks after the quarter ends. Listed business development companies (BDCs) hold portfolios of exactly these loans, and their shares trade every day. So there are two views of the same assets: the manager's mark, and the market's price.
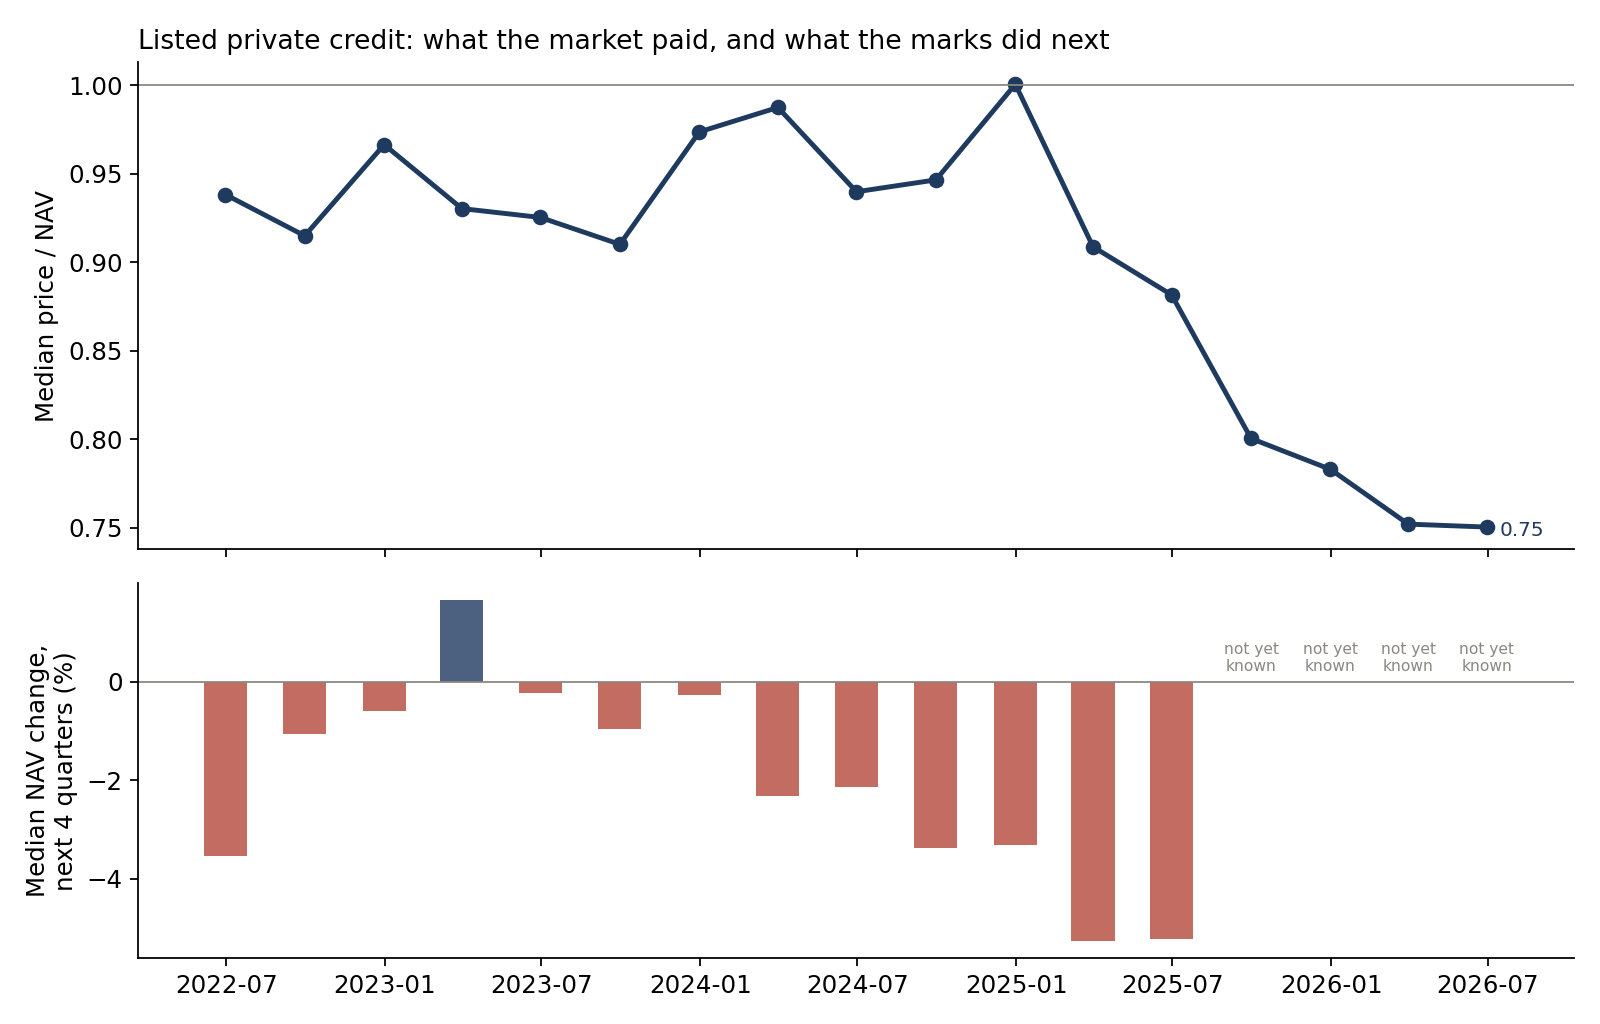
When the two disagree, which one moves? On real data for 44 listed BDCs from 2022 to 2025, the answer is that the marks tend to follow the market. A BDC that traded cheaper than its peers once its NAV was public was marked down more than its peers over the following year, in every one of the 13 quarters tested.
That matters now. On 19 October 2026 the median BDC traded at 0.66 times its last reported NAV.
Executive summary
The question. Does the discount at which a listed BDC trades to its NAV anticipate markdowns in its private-loan book, and how should a valuation committee or a private-credit risk team use that information?
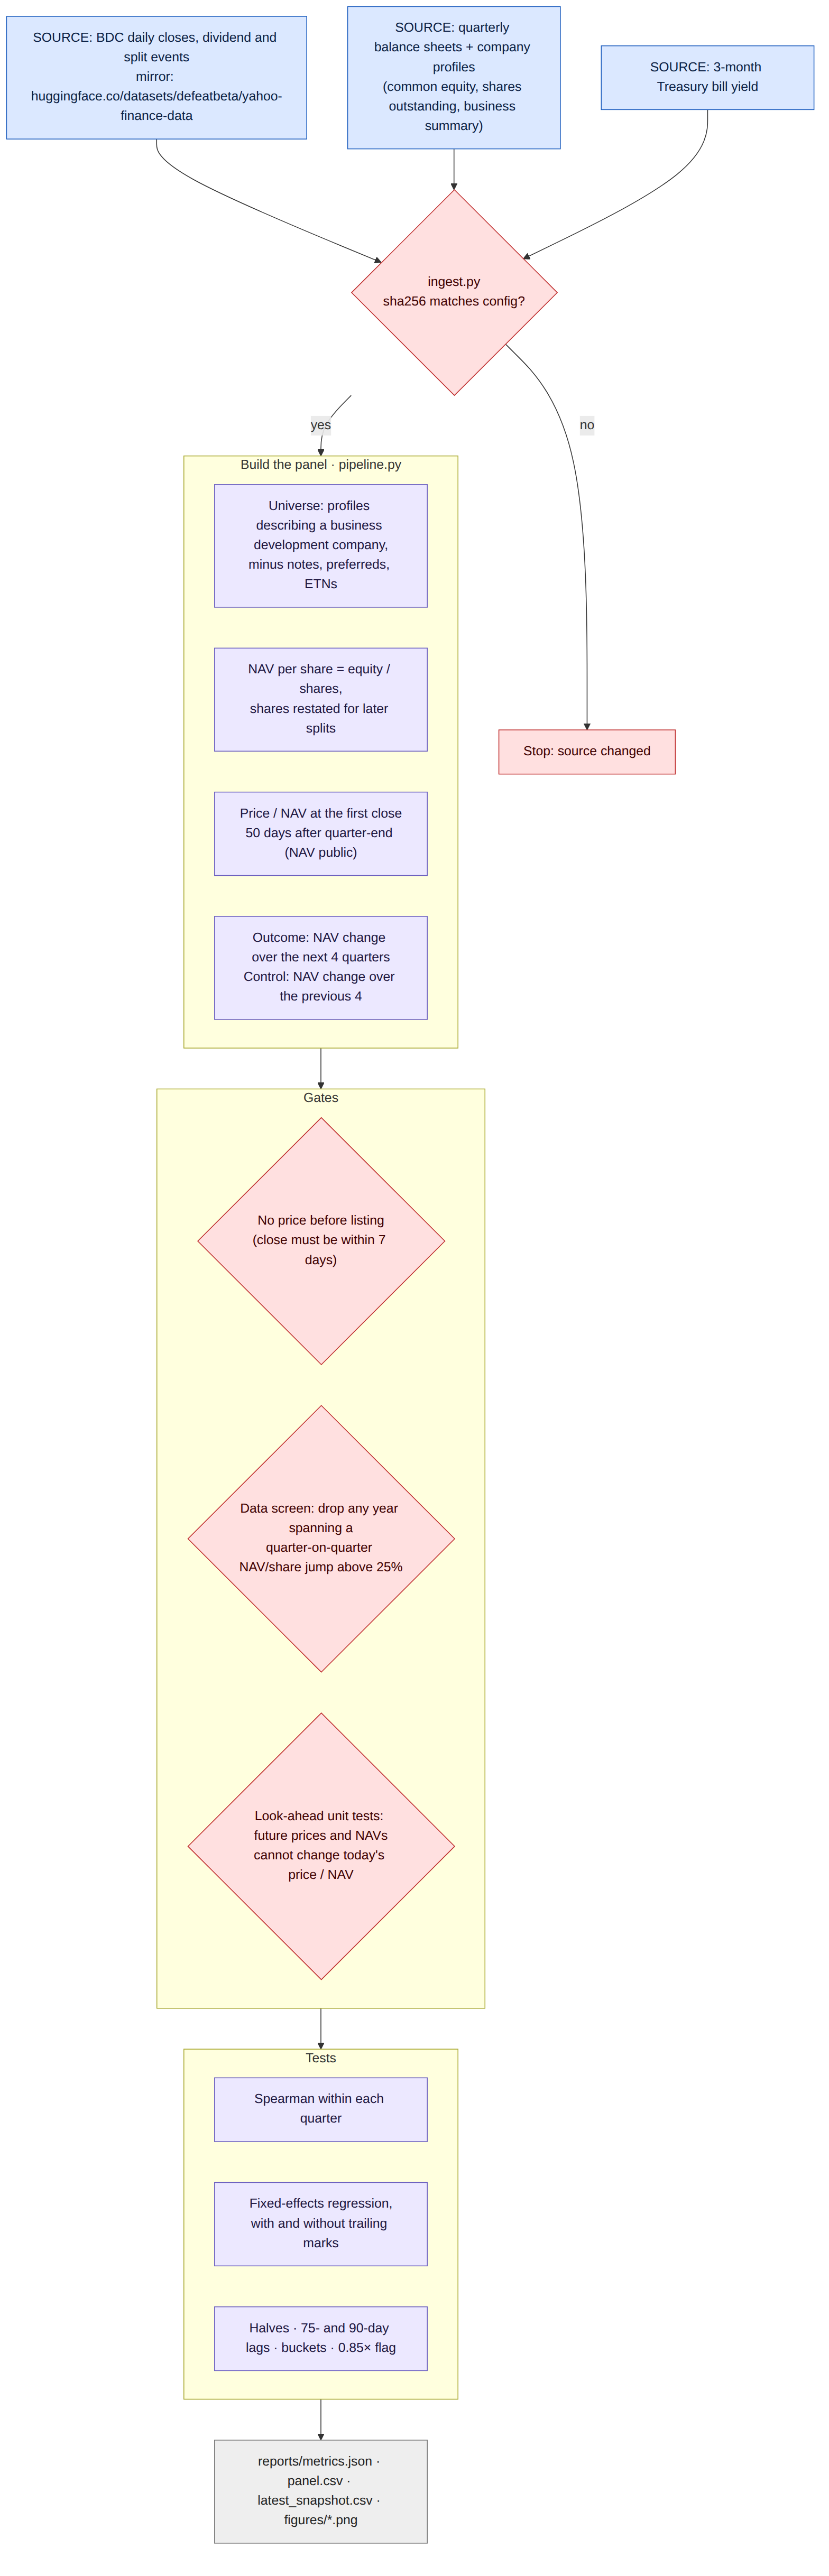
The approach. Every listed US BDC with quarterly balance sheets and trading prices: 44 BDCs and 459 BDC-quarters after data-quality screens, with NAVs from mid-2022 and outcomes to mid-2025. For each quarter, NAV per share is treated as public 50 days after quarter-end, and price / NAV is taken at the first close after that date. The outcome is the change in NAV per share over the next four quarters. The tests compare BDCs within the same quarter, so a sector-wide move cannot drive the result, and they control for each manager's own trailing marks.
The answer. Cheaper BDCs were marked down more. The rank correlation between price / NAV and the next year's NAV change averaged 0.26 and was positive in all 13 quarters. With quarter fixed effects, 10 points of price / NAV corresponded to 1.1 points of NAV change over the next year. The discount still carried information after allowing for the momentum in a manager's own marks, and the relation was more than twice as strong in the 2024–25 credit stress as in 2023–24. Among BDCs priced below 0.85× NAV, 43% cut NAV by more than 5% within a year, against 24% for those at a premium. Shareholders of the deep-discount group still earned 6.1% over the next 12 months: the price had already absorbed the markdown. The market saw it first; the marks caught up.
The decision it supports. Treat a listed peer's discount as evidence a valuation committee must address, not as a price to mark to. When a BDC holding the same names trades at a deep discount, re-test those marks first.
Business outcomes
| Dimension | Result | What it means |
|---|---|---|
| Rank correlation, price / NAV vs next-year NAV change, within quarter | 0.26 on average; positive in 13 of 13 quarters (t = 7.2) | A consistent signal, not a one-period accident |
| NAV change per 10 points of price / NAV, quarter fixed effects | 1.1 points (slope 0.114, se 0.021) | Modest per name, material across a book |
| Same, controlling for the manager's trailing marks | 0.8 points (slope 0.084, se 0.019) | The market adds information the marks' own trend does not |
| Strength in the 2024–25 stress vs 2023–24 | 0.154 vs 0.061 | The signal matters most when markdowns are largest |
| NAV down more than 5% within a year: below 0.85× / 0.85–1.00× / premium | 43% / 39% / 24% | Discounts concentrate the markdowns |
| 12-month total return to shareholders, same groups | 6.1% / 0.3% / 5.4% | The discount was already in the price |
| Simple flag, price below 0.85× NAV | Precision 43% vs 35% base rate; recall 34% | A prompt for challenge, not a forecast |
| Later markdown per 10 points of relative discount on $1bn of NAV | About $11.4M | The scale a valuation committee is debating |
| Median price / NAV today (19 Oct 2026) | 0.66×; 75% of BDCs below 0.85× | The market is pricing markdowns the marks do not yet show |
44 listed BDCs, 459 BDC-quarters, NAVs from June 2022, outcomes through June 2025. The dollar figure applies the fixed-effects slope to an illustrative $1bn of NAV and describes BDCs relative to their peers, not a forecast for the sector as a whole.
End to end in five steps
| Step | What happens | Output |
|---|---|---|
| 1. Source | BDC daily prices, dividends and splits; quarterly balance sheets; company profiles; the 3-month Treasury bill; every file checksum-pinned | Raw data with provenance |
| 2. Build | NAV per share from equity and shares, restated for later splits; price / NAV at the first close 50 days after quarter-end; next-year and trailing NAV change | 459 BDC-quarters |
| 3. Screen | No price before listing; drop any year spanning a quarter-on-quarter NAV-per-share jump above 25% (a data artefact) | Clean panel; 38 observations removed and listed |
| 4. Test | Rank correlation within quarter; fixed-effects regression with and without trailing marks; halves; 75- and 90-day lags; buckets; look-ahead unit tests | Signal strength and stability |
| 5. Translate | Apply the slope to an illustrative $1bn book; today's discounts across the sector | Valuation-governance view |
The data
The universe is every listed US company whose business description identifies it as a business development company, less notes, preferred shares and exchange-traded notes. NAV per share comes from each BDC's quarterly balance sheet (common equity divided by shares outstanding), with share counts restated for later splits so they line up with split-adjusted prices.
Two choices keep the test honest. First, the NAV is only used once it is public: 50 days after quarter-end, beyond the 40- to 45-day filing deadline for quarterly reports. Year-end NAVs can take up to 60 days, so the whole test was rerun at 75 and 90 days; the results barely moved. Second, the first run surfaced NAV-per-share jumps of 50% to 100% in a single quarter at five BDCs, caused by reverse splits, share-count errors and pre-listing prices in the source data. Any observation whose year spans a quarter-on-quarter jump above 25% is removed. That also removes any genuine single-quarter collapse, which makes the result conservative. Before the screen, the relation looked stronger (a slope of 0.150) and trailing marks looked useless; the screened numbers are the ones reported.
What the discount told us
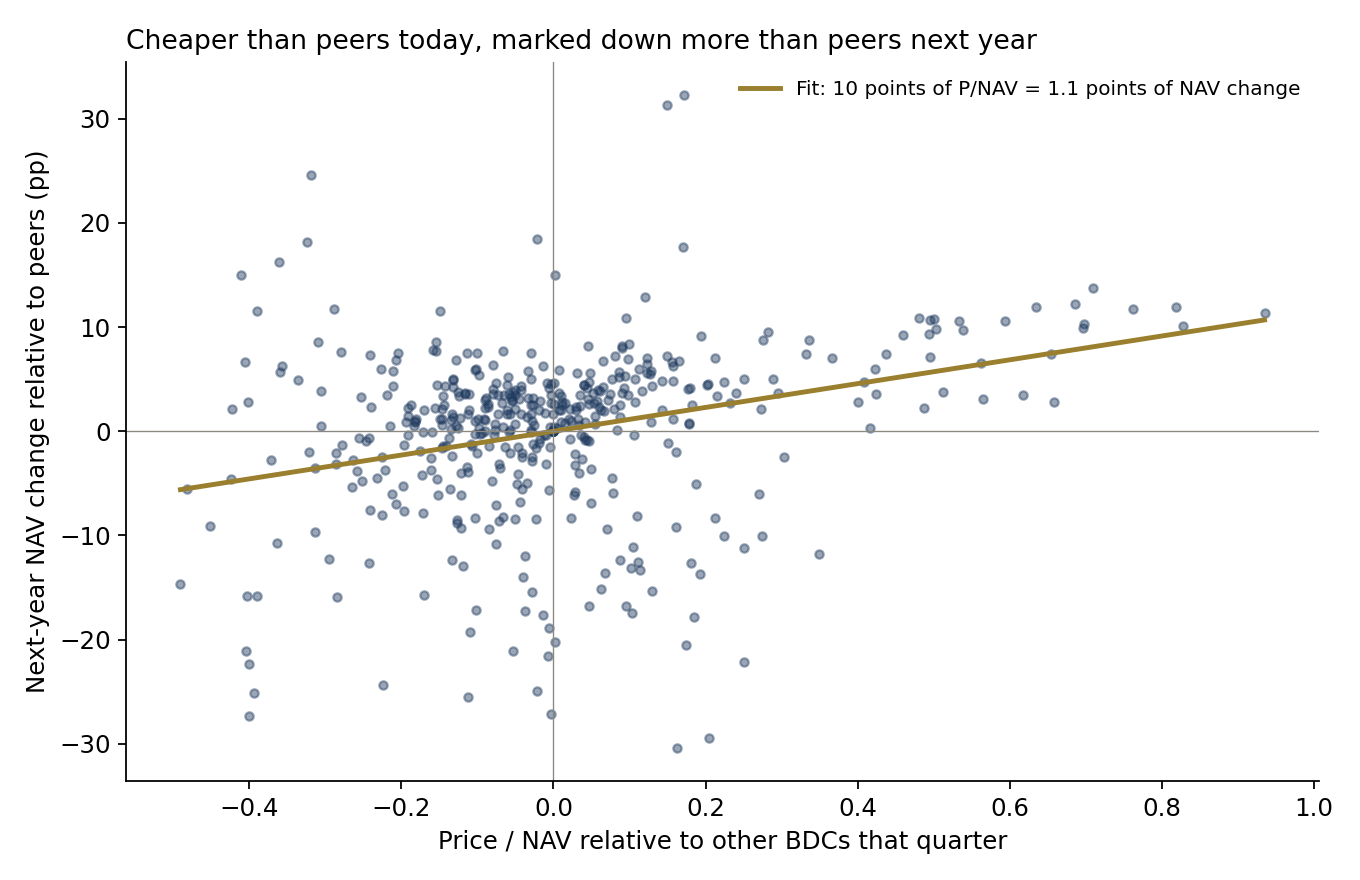
| Test (459 BDC-quarters, 44 BDCs) | Result |
|---|---|
| Rank correlation within quarter | mean 0.26; positive in 13 of 13 quarters; t = 7.2 |
| Fixed-effects slope, price / NAV only (n = 304) | 0.114 (se 0.021); R² 0.09 |
| Trailing 12-month NAV change only | 0.525 (se 0.058); R² 0.21 |
| Both together | price / NAV 0.084 (se 0.019); trailing 0.478 (se 0.058); R² 0.26 |
| Outcome quarters May 2023 – Jun 2024 | 0.061 (se 0.028) |
| Outcome quarters Aug 2024 – Jun 2025 | 0.154 (se 0.030) |
| NAV public at 75 / 90 days instead of 50 | 0.117 / 0.123; positive in 13 of 13 quarters |
Regressions demean every variable within its quarter (quarter fixed effects). The regression sample is smaller because it needs a trailing year of NAVs.
Two findings stand out. Managers' marks have momentum: a BDC whose NAV fell over the past year tended to keep falling, which is what you would expect if marks adjust gradually. But the market's discount added information on top of that trend. And the signal was strongest exactly when it mattered most, in the 2024–25 period of falling base rates and rising credit stress, when the median BDC lost more than 5% of NAV in a year.
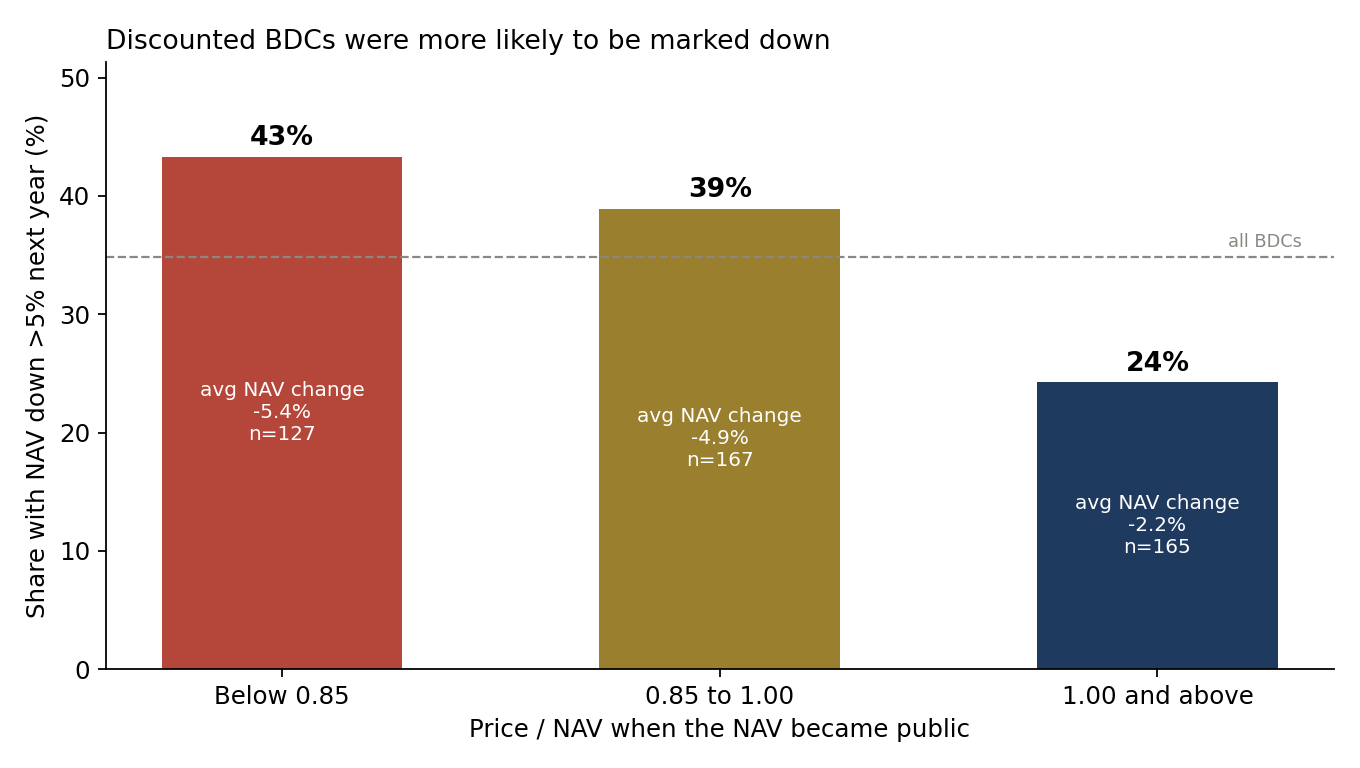
| Price / NAV when the NAV became public | n | Median P/NAV | Avg NAV change, next year | NAV down > 5% | 12-month total return | Dividend yield |
|---|---|---|---|---|---|---|
| Below 0.85 | 127 | 0.77 | −5.4% | 43% | 6.1% | 13.0% |
| 0.85 to 1.00 | 167 | 0.93 | −4.9% | 39% | 0.3% | 11.5% |
| 1.00 and above | 165 | 1.10 | −2.2% | 24% | 5.4% | 10.5% |
The deep-discount group's shareholders still earned 6.1%, about the same as the premium group: the markdown was in the price before it was in the NAV.
Where the market stands today
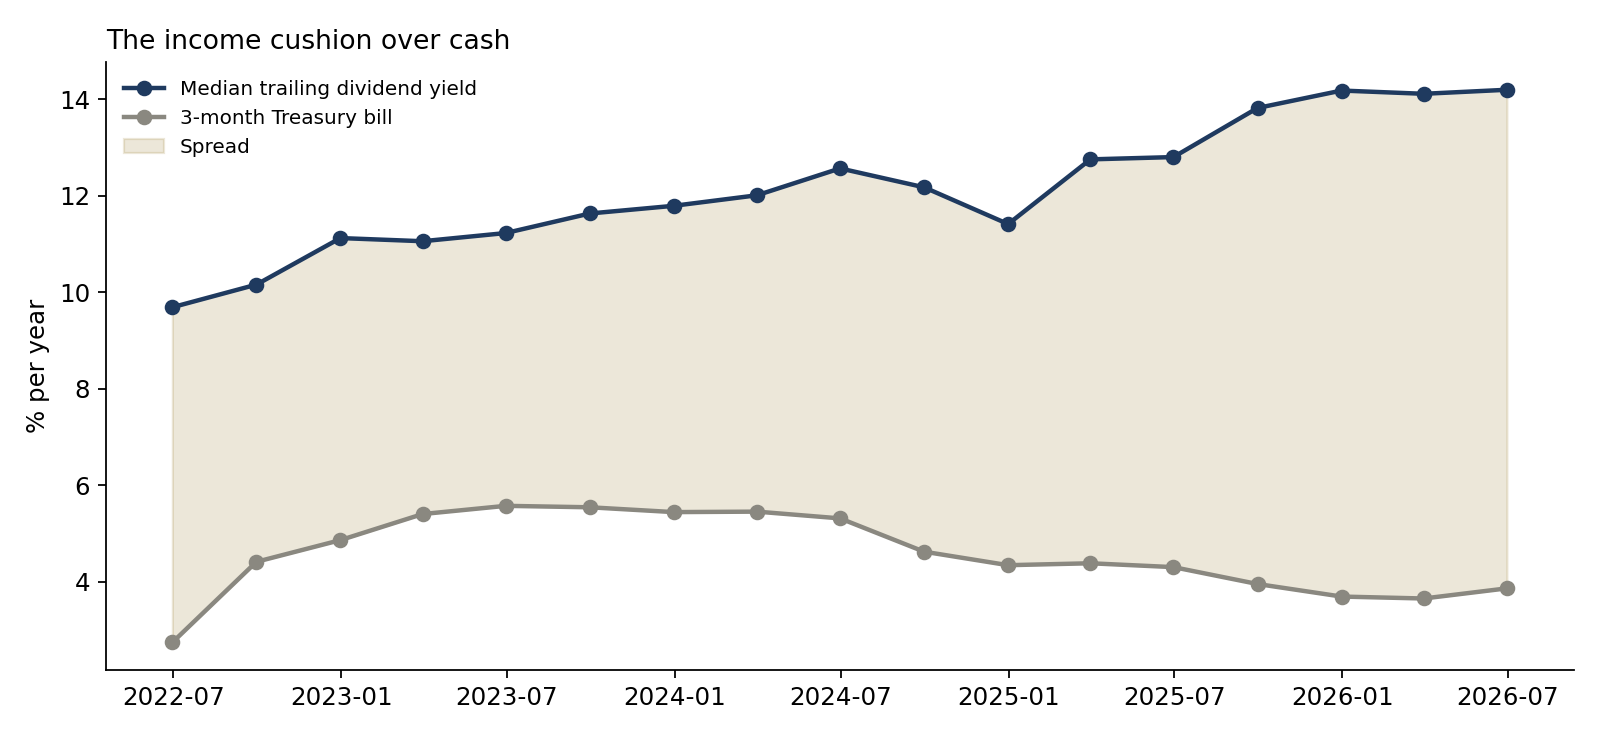
On 19 October 2026, against their 30 June NAVs, 44 BDCs had a median price / NAV of 0.66×. Three in four traded below 0.85× and almost nine in ten below 1.00×. The median trailing dividend yield was 15.1%, against 4.27% on a 3-month Treasury bill. The largest and most diversified lenders traded closest to NAV (Ares Capital 0.95×, Blackstone Secured Lending 0.92×); internally managed lenders still traded at premiums (Main Street 1.57×); and a long tail traded below 0.55×.
This model ranks BDCs against each other. It does not say how far the whole sector's NAV will fall. But a sector trading at two thirds of NAV is a market expecting markdowns that the June marks do not yet show.
Recommendations
- Make peer discounts a standing valuation-committee input. Report, each quarter, the price / NAV of listed BDCs next to the committee's own valuation changes. It is cheap, public and timely.
- Re-test overlapping names first. Where a BDC trading below 0.85× holds the same borrowers, re-mark those positions against current comparables before the quarter closes.
- Document the gap, don't mark to it. A share price prices fees, leverage, liquidity and dividend risk as well as credit. Under fair-value rules the committee must reach its own view; it must also be able to explain why it differs from the evidence in front of it.
- Watch the trend in your own marks. Trailing NAV declines predicted further declines. A book that marked down last year should not be assumed to have finished.
- For allocators: separate the two signals. A deep discount predicted markdowns, but not poor shareholder returns. For a buyer of BDC shares, the discount was already paying for the risk; for a holder of the underlying loans at NAV, it was a warning.
Limits
The universe is the BDCs listed today, so BDCs that merged or delisted between 2022 and 2026, probably more often the deep-discount ones, are missing. Quarterly statements in this source begin in 2022, so the outcomes cover one credit cycle. NAV per share is computed from balance-sheet equity and shares rather than taken from each BDC's own reported figure. The discount also reflects fees, leverage, liquidity and dividend policy. The regression ranks BDCs within a quarter and is not a forecast for the sector. The dollar figure is illustrative. This is independent research on public data; it is not investment advice and the model has not been deployed.

Sources
Data
- BDC daily closes, dividend and split events, quarterly balance sheets and company profiles, and the 3-month Treasury bill yield, Yahoo Finance. Copy used: huggingface.co/datasets/defeatbeta/yahoo-finance-data (ODC-BY)
Context and methods referenced
- Lee, C., Shleifer, A. and Thaler, R. (1991). "Investor Sentiment and the Closed-End Fund Puzzle." The Journal of Finance 46(1), 75–109.
- Pontiff, J. (1995). "Closed-end fund premia and returns: Implications for financial market equilibrium." Journal of Financial Economics 37(3), 341–370.
- Cherkes, M., Sagi, J. and Stanton, R. (2009). "A Liquidity-Based Theory of Closed-End Funds." The Review of Financial Studies 22(1), 257–297.
- US Securities and Exchange Commission (2020). "Good Faith Determinations of Fair Value," Rule 2a-5 under the Investment Company Act, Release No. IC-34128.
Independent research, not investment advice. Dollar figures are illustrative. Analysis, code, charts and text were produced with AI assistance and reviewed by the author.