Earnings season is the busiest four weeks in a systematic equity calendar. One of the oldest findings in finance says it is also the most predictable: stocks that beat their earnings keep drifting up for weeks, and stocks that miss keep drifting down. Generations of quant books were built on that idea. More recent research argues the effect has largely disappeared outside the smallest, least tradable stocks.
That leaves a portfolio manager with a practical question. Does post-earnings drift still earn its place in a book today, where does it survive, and what does it pay after trading costs? I tested it on every US earnings announcement in a public calendar from January 2023 to October 2026.
Executive summary
The question. Should a systematic equity book still trade post-earnings-announcement drift, and if so, in which stocks and at what cost of execution?
The approach. 43,111 earnings announcements by 4,058 US-listed companies, January 2023 to October 2026, after excluding stocks under $5 or trading under $1M a day. Two signals, both known by the close of the day after the announcement: the earnings surprise against the company's own history (SUE), and the stock's price reaction around the announcement (EAR). The outcome is the return over the next 60 trading days against the S&P 500, by signal quintile and company size, and as a daily long-short portfolio after trading costs. Breakpoints use only past announcements.
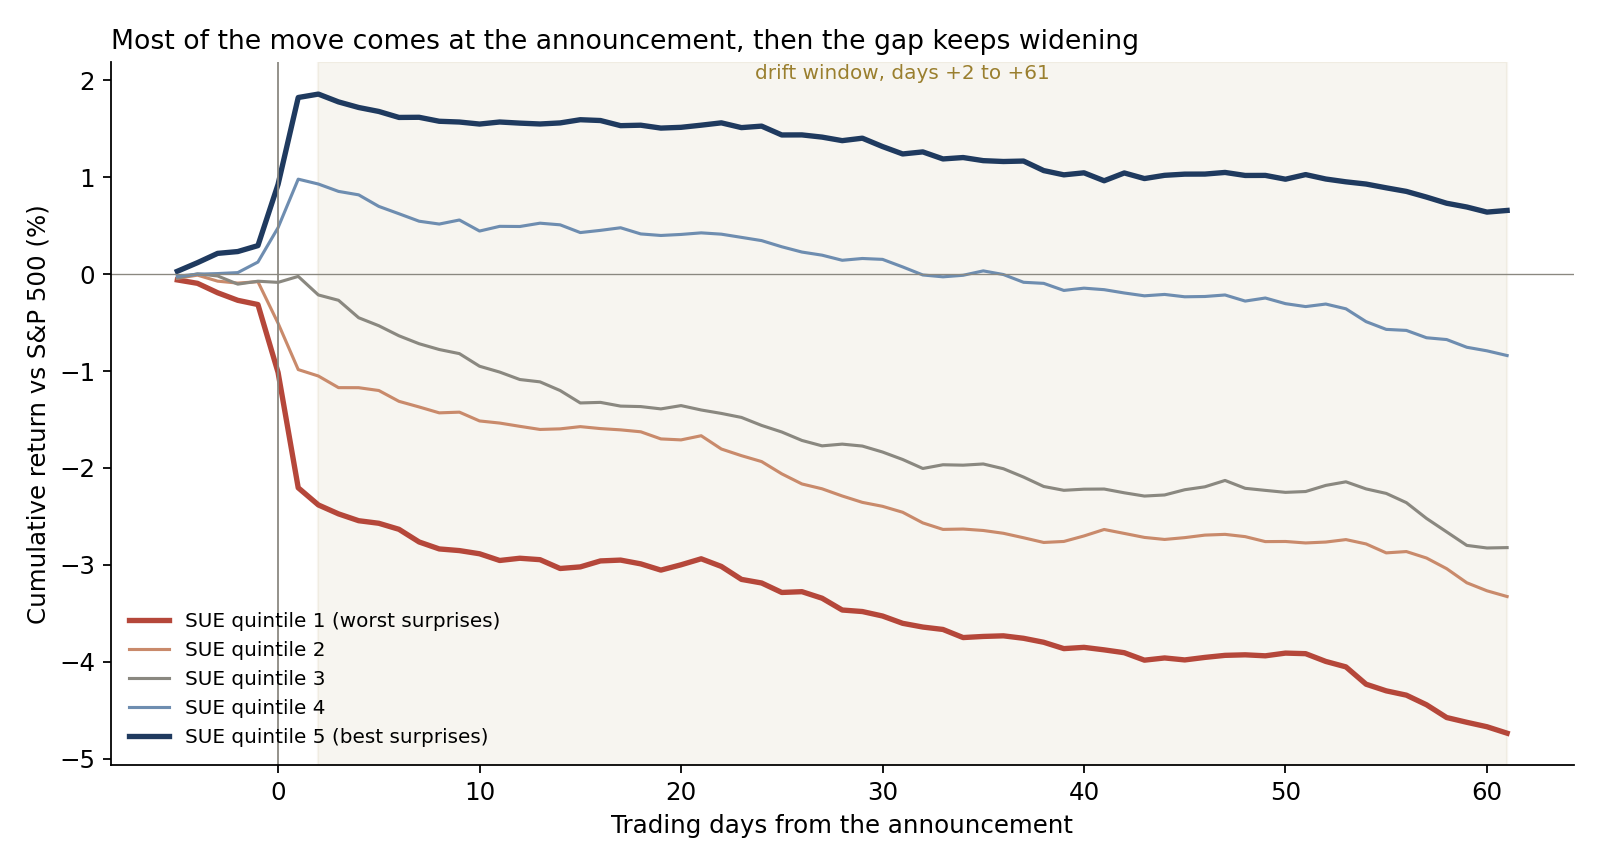
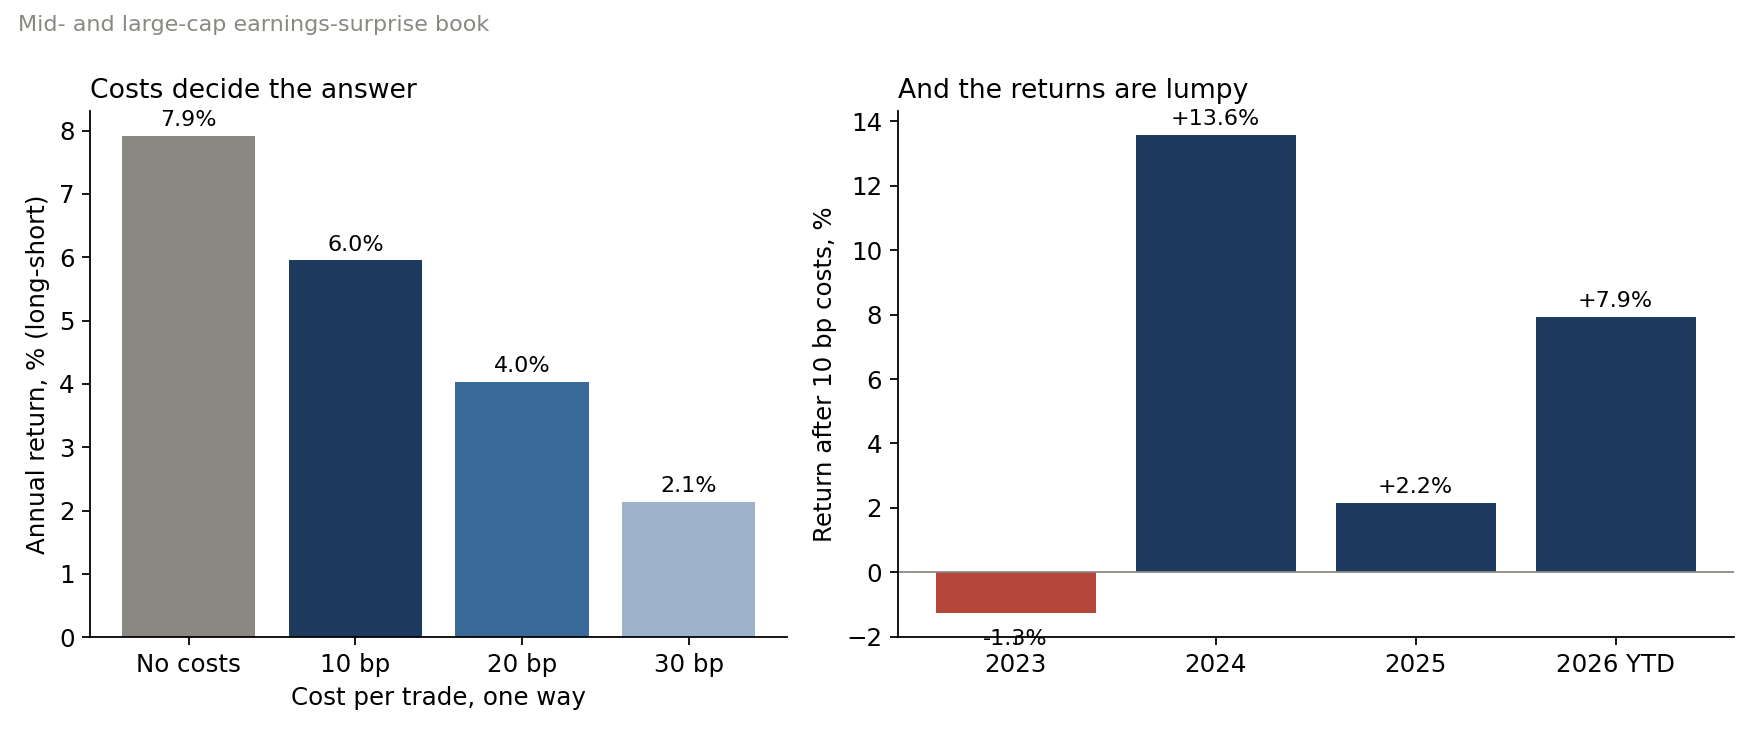
The answer. The drift is still there. The best-surprise fifth of stocks beat the worst by 1.7 percentage points over 60 days, and the result held in every size group, including large caps (2.0 points). The earnings surprise itself was a better signal than the price reaction. But it has weakened, from 2.6 points for announcements in 2023–24 to 0.5 in 2025–26, and costs decide whether it pays: a mid- and large-cap book earned 6.0% a year after 10 basis points per trade and 2.1% at 30.
The decision it supports. Keep earnings drift as one signal among several in a liquid book, sized modestly, with execution costs measured and a pre-agreed rule to cut it if the spread keeps shrinking. Do not run it as a standalone strategy, and do not chase the large micro-cap numbers.
Business outcomes
| Dimension | Result | What it means |
|---|---|---|
| Best minus worst surprise quintile, 60 days, all sizes | +1.7 pp (t = 4.2, 15 quarters) | A real but modest edge |
| Large caps over $10bn | +2.0 pp (t = 3.4) | Not only a micro-cap effect in this sample |
| Announcements 2023–24 vs 2025–26 | +2.6 pp vs +0.5 pp | The edge is fading |
| Price reaction (EAR) as the signal | +1.3 pp (t = 1.4) | The surprise beats the price move |
| Mid- and large-cap long-short, before costs | 7.9% a year, Sharpe 1.21 | The gross opportunity |
| Same, after 10 / 20 / 30 bp per trade | 6.0% / 4.0% / 2.1% a year | Execution decides the answer |
| Year by year after 10 bp | −1.3%, +13.6%, +2.2%, +7.9% (2026 to date) | Lumpy, concentrated in 2024 |
| $100M long and $100M short, mid and large caps | About $6.0M a year after 10 bp; worst drawdown about $5.3M | Illustrative scale of the opportunity |
43,111 announcements, January 2023 to October 2026. Returns are against SPY. t-statistics on quarterly averages of the spread. Costs are illustrative one-way costs charged when a name enters and leaves the book. Dollar figures apply the measured returns to an illustrative book.
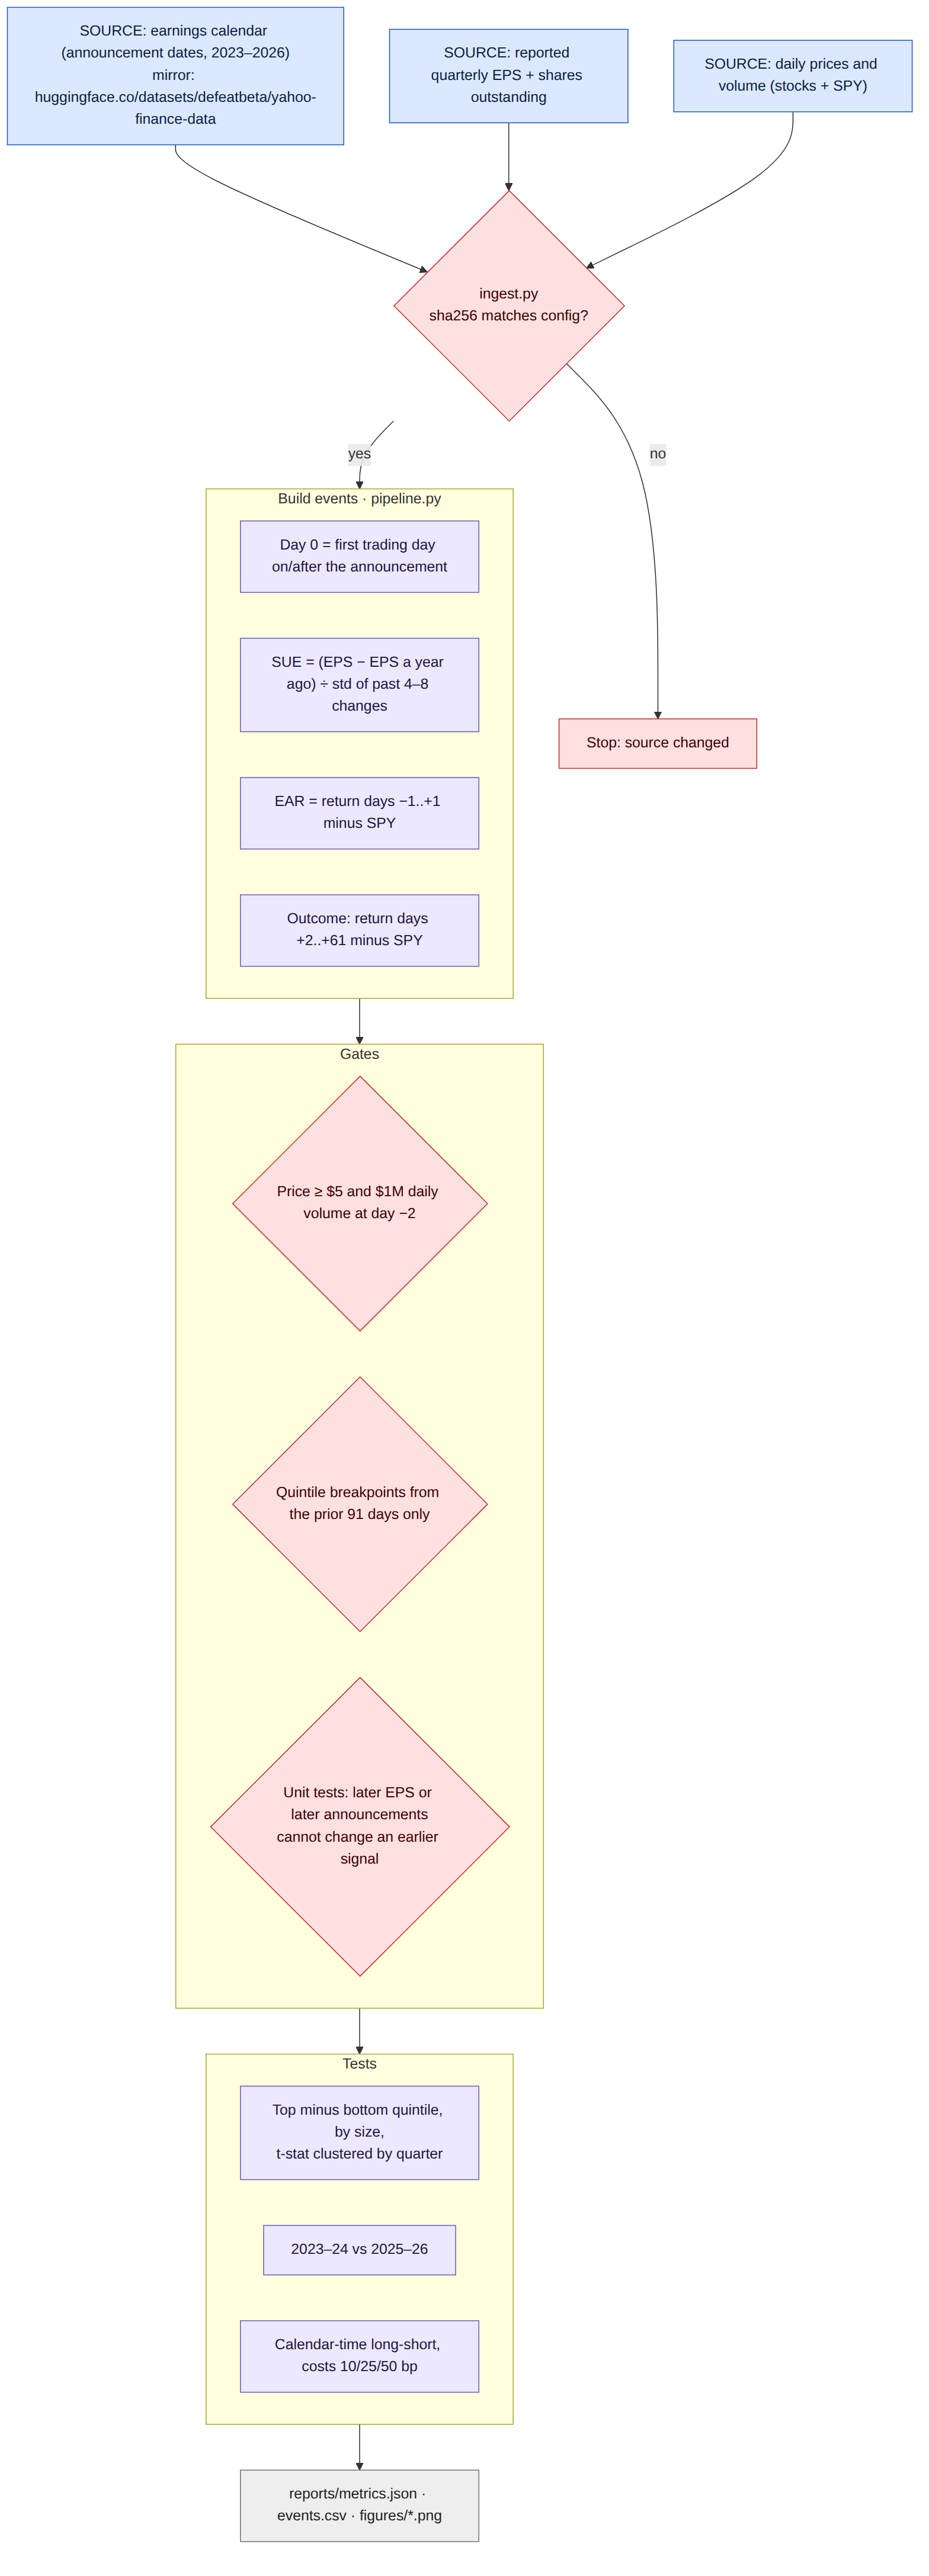
End to end in five steps
| Step | What happens | Output |
|---|---|---|
| 1. Source | Earnings calendar, reported EPS, shares outstanding and daily prices; every file checksum-pinned | Raw data with provenance |
| 2. Build | Day 0 at the announcement; SUE from the company's own EPS history; EAR from the price move over days −1 to +1 | 43,111 announcements |
| 3. Screen | Price at least $5 and $1M daily volume at day −2; quintile breakpoints from the prior 91 days only | No look-ahead, tradable names |
| 4. Test | Top minus bottom quintile over days +2 to +61, by size and by period; t-statistics by announcement quarter | Strength and stability |
| 5. Trade | Daily long-short portfolio of names in their 60-day window, costs of 10, 25 and 50 bp by size | Return after costs |
The data
The announcement dates come from a public earnings calendar that starts in January 2023, matched to each company's reported quarterly earnings per share, shares outstanding and daily prices. All of it is Yahoo Finance data in a public mirror, pinned by checksum. After the price and liquidity filters, the sample is 43,111 announcements by 4,058 companies: 11,897 large caps, 14,741 mid caps, 14,593 small caps and 1,830 micro caps.
Two choices keep the test honest. Positions are formed only at the close of the day after the announcement, so the drift is measured from day +2, after the immediate price reaction. And the quintile breakpoints for any announcement use only announcements from the previous 91 days. Unit tests confirm that changing later earnings or later announcements does not change an earlier signal.
The signals, in plain terms
| Signal | Definition used here | Known when the position is formed? |
|---|---|---|
| Earnings surprise (SUE) | EPS this quarter minus EPS in the same quarter a year earlier, divided by how much that change has varied over the previous 4–8 quarters | Yes, at the announcement |
| Announcement return (EAR) | The stock's return from the close before day −1 to the close of day +1, minus the S&P 500 | Yes, at the close of day +1 |
| Drift | Return over trading days +2 to +61, minus the S&P 500 | Outcome only |
What the drift looks like now
| 60-day return vs S&P 500, days +2 to +61 | All | Micro < $300M | Small $300M–2B | Mid $2–10B | Large > $10B |
|---|---|---|---|---|---|
| Top minus bottom surprise quintile | +1.7 pp | +6.2 pp | +1.1 pp | +1.4 pp | +2.0 pp |
| t-statistic (15 quarters) | 4.2 | 1.8 | 2.1 | 2.9 | 3.4 |
| Announcements 2023–24 | +2.6 | +8.9 | +2.2 | +2.2 | +2.3 |
| Announcements 2025–26 | +0.5 | +4.2 | −0.2 | +0.4 | +1.7 |
Equal-weighted averages across announcements; quintiles formed on the whole universe with breakpoints from the previous 91 days.
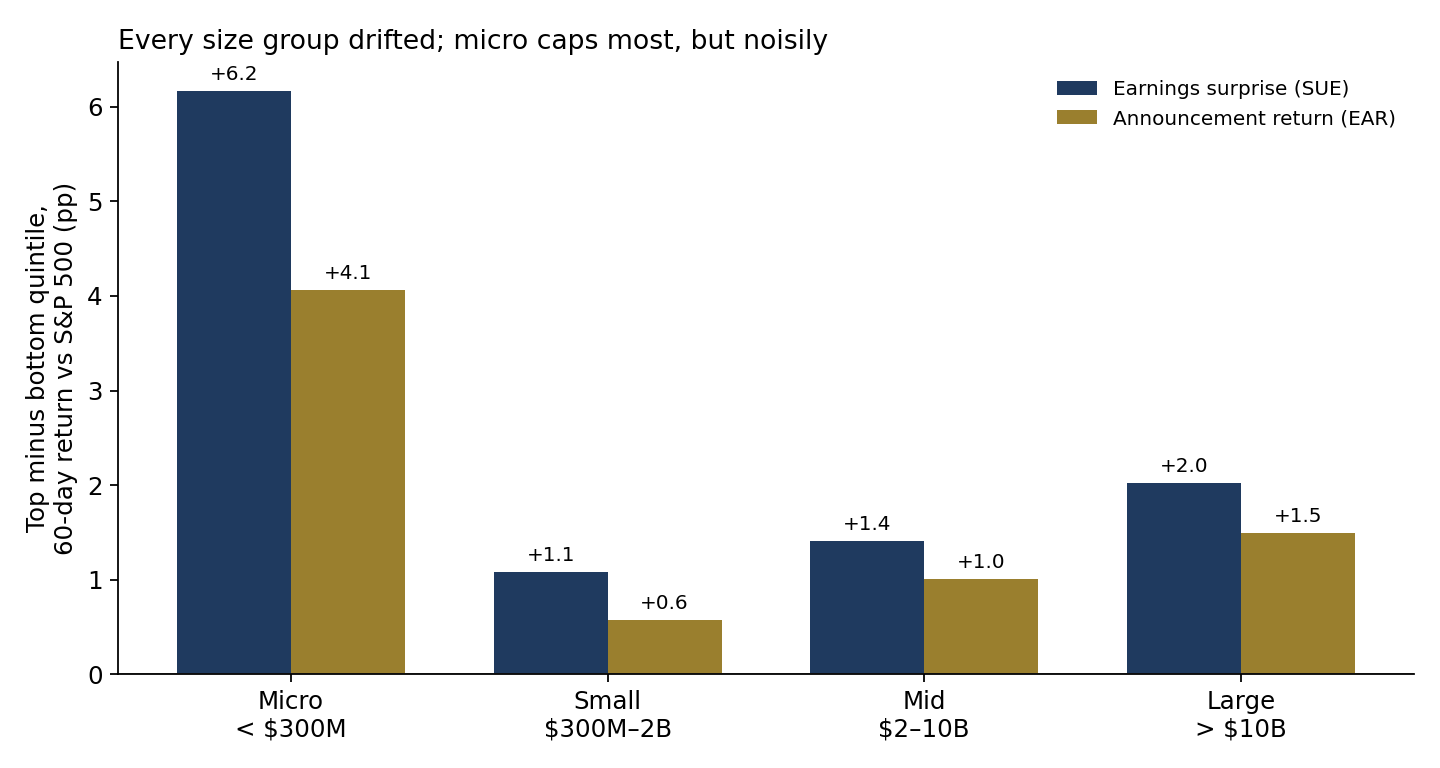
Three findings matter for a decision. First, this sample does not match the view that drift survives only in the smallest stocks: large caps showed a 2.0-point spread with the strongest statistics of any group. Second, the earnings number carried more information than the market's first reaction to it; the price-reaction signal was weaker and statistically marginal. Third, the effect is fading. Announcements in 2025–26 produced a spread of 0.5 points overall, against 2.6 points in 2023–24, and only large caps held up.
What it pays as a book
| Long-short book (top vs bottom surprise quintile) | Before costs | After costs | Cost, one way | Sharpe after costs | Worst drawdown |
|---|---|---|---|---|---|
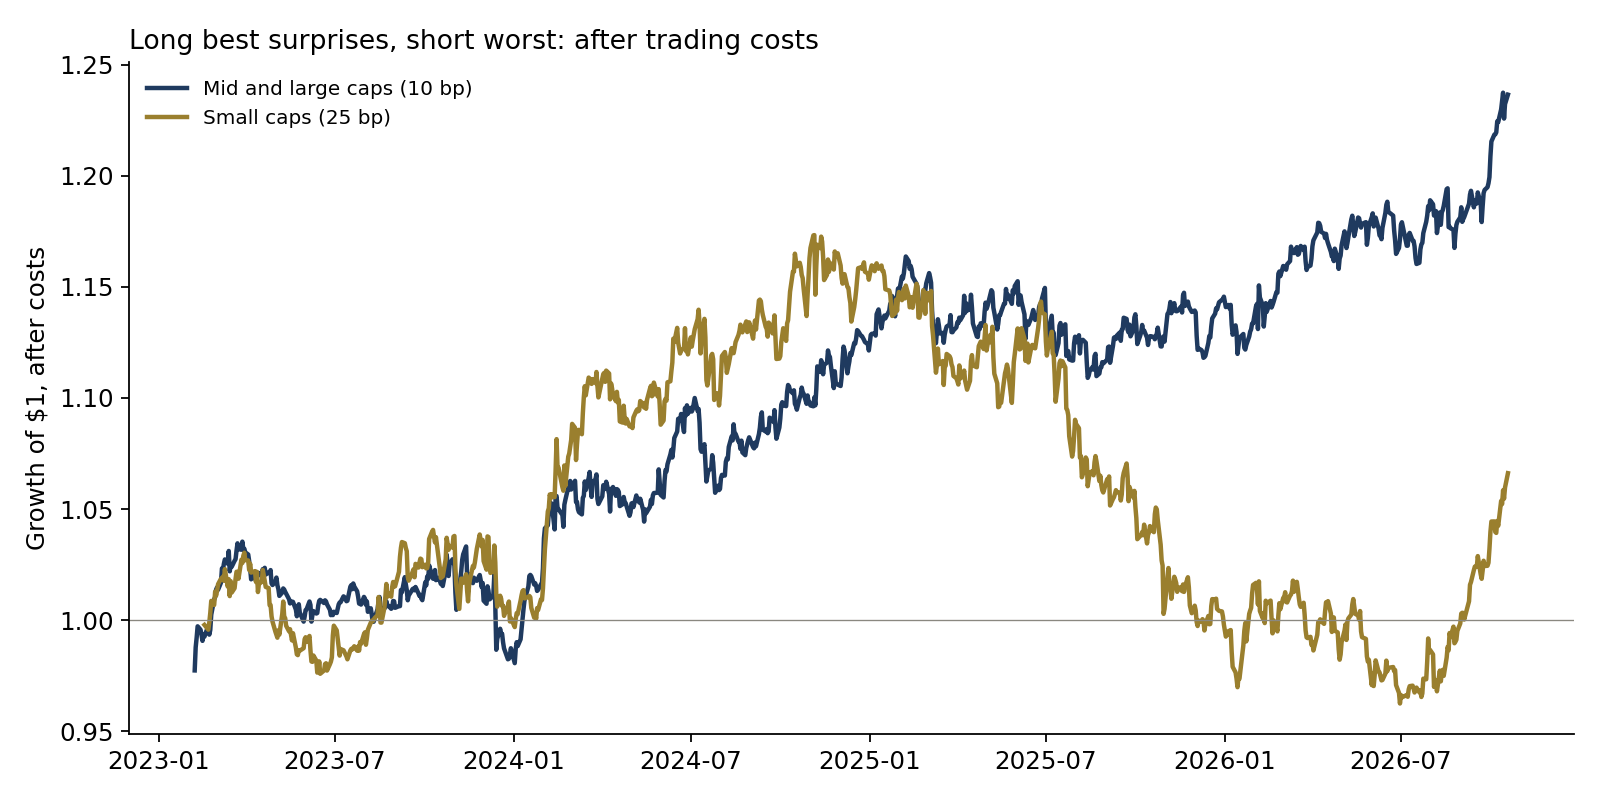
| Mid and large caps | 7.9% a year | 6.0% | 10 bp | 0.93 | −5.3% |
| Same at 20 / 30 bp | 4.0% / 2.1% | 0.64 / 0.36 | |||
| Small caps | 6.6% | 1.8% | 25 bp | 0.26 | −18% |
| Micro caps | 28.6% | 20.8% | 50 bp | 0.66 | −31% |
Daily equal-weighted returns against SPY, February 2023 to October 2026. The micro-cap book often held only a handful of names and is not investable at size.
Recommendations
- Keep it as one signal, not a strategy. In a multi-signal equity model, the earnings surprise adds a modest, documented edge. On its own it was flat in 2023 and strong in 2024: too lumpy to carry a book.
- Trade it where execution is cheap. The edge in mid and large caps survives 10 basis points per trade and is mostly gone at 30. Measure realized costs on every earnings trade; the backtest assumption is the weakest number in the case.
- Use the earnings number, not just the price move. The surprise against the company's own history was the stronger signal in every size group.
- Write the exit rule now. The spread fell from 2.6 to 0.5 points between the two halves of the sample. Cut the allocation if the rolling one-year spread reaches zero.
- Ignore the micro-cap headline. A 6-point spread on few names, with weak statistics and a 31% drawdown, is a capacity and cost problem, not an opportunity.
Limits
The announcement calendar in this source starts in January 2023, so the test covers under four years and one market regime, in which the average stock trailed the S&P 500. The price history includes many acquired companies but not all failed ones, which probably understates the short leg. The surprise is measured against each company's own earnings history rather than analyst forecasts, and the stored EPS figures may include later restatements. Price returns exclude dividends. Costs and capacity are illustrative. This is independent research on public data; it is not investment advice and the strategy has not been deployed.

Sources
Data
- Earnings calendar, reported quarterly EPS, shares outstanding and daily prices, Yahoo Finance. Copy used: huggingface.co/datasets/defeatbeta/yahoo-finance-data (ODC-BY)
Methods referenced
- Ball, R. and Brown, P. (1968). "An Empirical Evaluation of Accounting Income Numbers." Journal of Accounting Research 6(2), 159–178.
- Bernard, V. and Thomas, J. (1989). "Post-Earnings-Announcement Drift: Delayed Price Response or Risk Premium?" Journal of Accounting Research 27 (Supplement), 1–36.
- Chan, L., Jegadeesh, N. and Lakonishok, J. (1996). "Momentum Strategies." The Journal of Finance 51(5), 1681–1713.
- Martineau, C. (2022). "Rest in Peace Post-Earnings Announcement Drift." Critical Finance Review. doi.org/10.1561/104.00000122
Independent research, not investment advice. Dollar figures are illustrative. Analysis, code, charts and text were produced with AI assistance and reviewed by the author.