Borrowing in a currency that pays nothing to hold one that pays something is one of the oldest trades in macro. With central banks moving at different speeds again, it is back on the agenda, and so is the question every committee should ask first: what has it actually earned, after costs, on currencies an investor can hold?
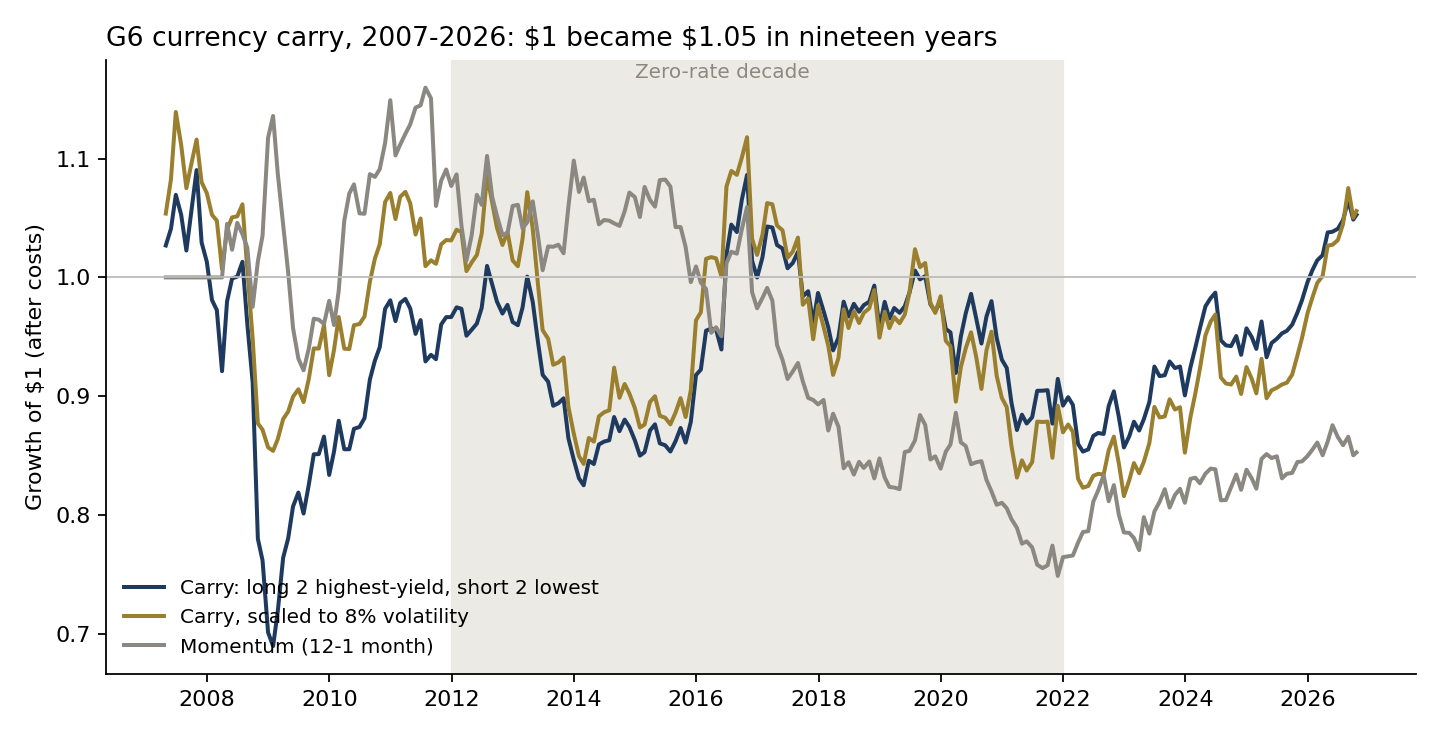
On real data from April 2007 to October 2026, a book long the two highest-yielding and short the two lowest-yielding of six major currencies turned $1 into $1.05. Along the way it fell to $0.69. The premium exists, but only in some regimes, and the month it breaks can wipe out decades of income.
Executive summary
The question. Should a multi-asset portfolio own currency carry now that interest-rate differentials are back, and if so, how large can the book be when the carry trade unwinds?
The approach. Six currency trusts (AUD, GBP, CAD, EUR, CHF, JPY against the US dollar) that hold foreign-currency deposits and pass the interest through each month. Their total return is exactly what an investor earned: the currency move plus the deposit yield, net of fees. At each month-end the book ranks the six by the yield they actually paid over the previous 91 days and goes long the top two and short the bottom two. Five rules were fixed before any result was seen: plain carry; carry only when the yield gap is at least one point; carry scaled to a constant 8% volatility; momentum, as an alternative signal; and a long-all-six short-dollar basket, as the passive comparison. Costs of 10 basis points per unit of turnover. 235 months.
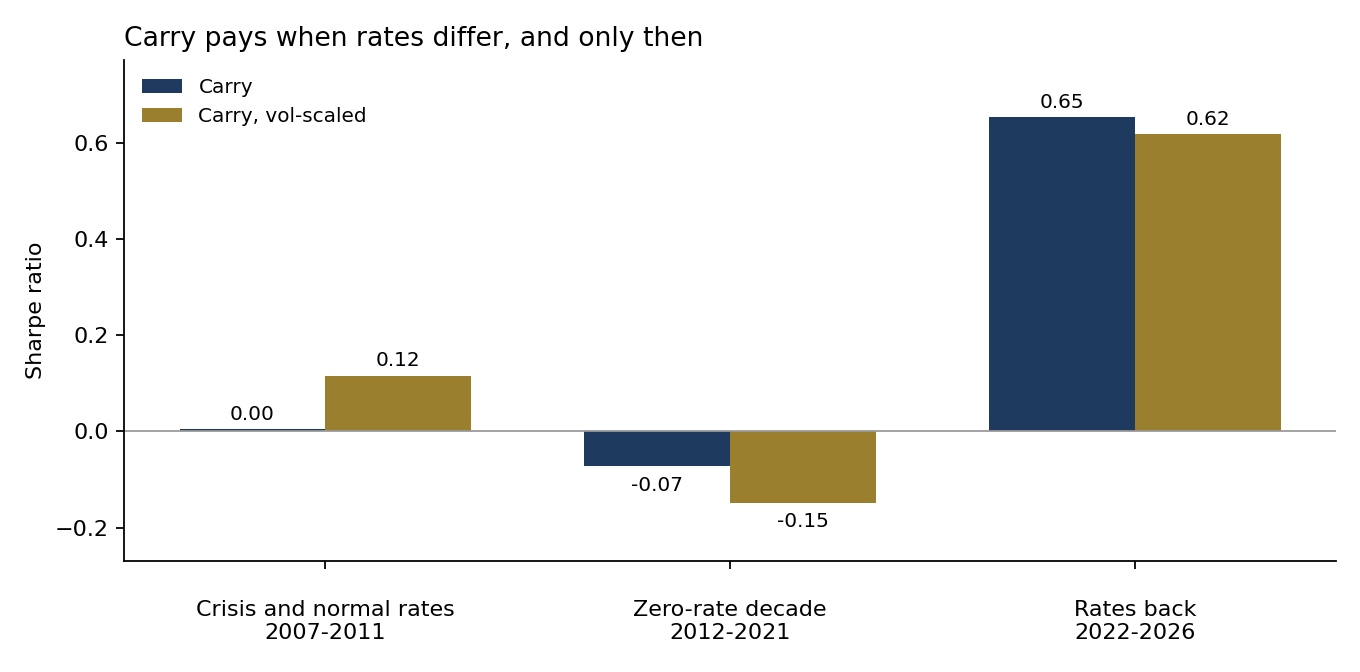
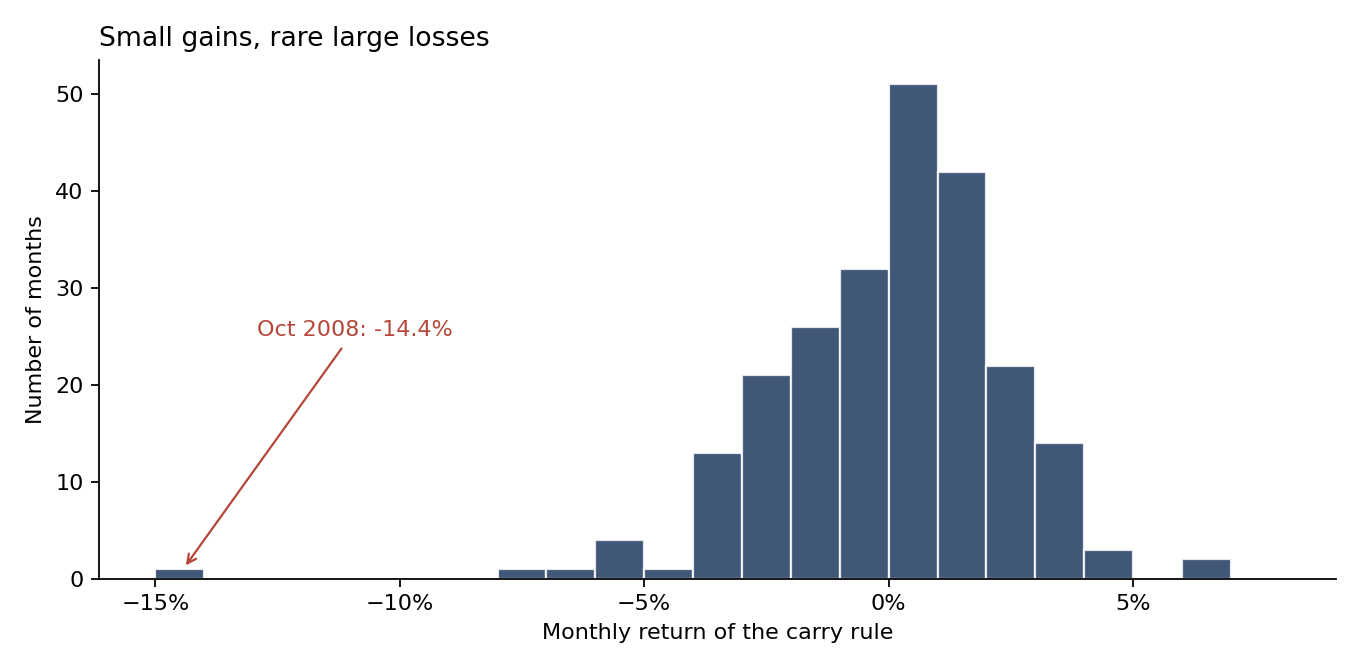
The answer. Plain carry earned 0.6% a year with a Sharpe ratio of 0.07. That average hides three different regimes: a crash in 2008 that cost 30.8% in one calendar year, a zero-rate decade (2012–2021) in which there was almost nothing to harvest and the book lost 0.5% a year, and a return of rate differentials since 2022 that has paid 3.6% a year with a Sharpe ratio of 0.65. Scaling the book to constant volatility kept the return and roughly halved the crash: October 2008 cost 7.5% instead of 14.4%, and the maximum drawdown fell from 37% to 28%. Momentum lost money. The short-dollar basket earned almost nothing and behaved like equity risk.
The decision it supports. Own carry only while there is a yield gap to harvest, size it so that a 2008-style month is a known, budgeted loss, and run it volatility-scaled rather than at constant size. Do not count it as a diversifier in an equity sell-off.
Business outcomes
| Dimension | Carry, constant size | Carry, volatility-scaled | What it means |
|---|---|---|---|
| Return per year after costs, 2007–2026 | 0.62% | 0.63% | Same income from both rules |
| Sharpe ratio, 2007–2026 | 0.07 | 0.08 | Thin over the full cycle |
| Sharpe ratio, 2022–2026 | 0.65 | 0.62 | Pays when rates differ |
| Worst month | −14.4% (Oct 2008) | −7.6% (Nov 2016); Oct 2008 −7.5% | Scaling halves the crash |
| Maximum drawdown | −36.7% | −28.4% | Still a deep hole to fund |
| Worst month in months of average income | 278 | 145 | How long one bad month takes to earn back |
| Gross currency exposure, $1bn at 1% of NAV volatility | $118M | $118M | Size set by the risk budget |
| Expected P&L per year at that size | $0.74M | $0.75M | Full-sample average, not a forecast |
| October 2008 replayed at that size | −$17.1M | −$8.9M | The loss the committee must budget for |
| Average month in the S&P 500's worst 10% of months | −0.9% | −0.7% | Not a hedge |
Monthly total returns of the currency trusts after an illustrative 10 bp cost per unit of turnover. Sharpe ratio = annual return ÷ annual volatility; the book is dollar-neutral, so no cash rate is subtracted. Dollar figures apply the measured results to an illustrative $1bn portfolio: gross exposure = 1% × $1bn ÷ the book's annual volatility (8.4%); expected P&L = gross exposure × annual return; replay = gross exposure × the October 2008 return.
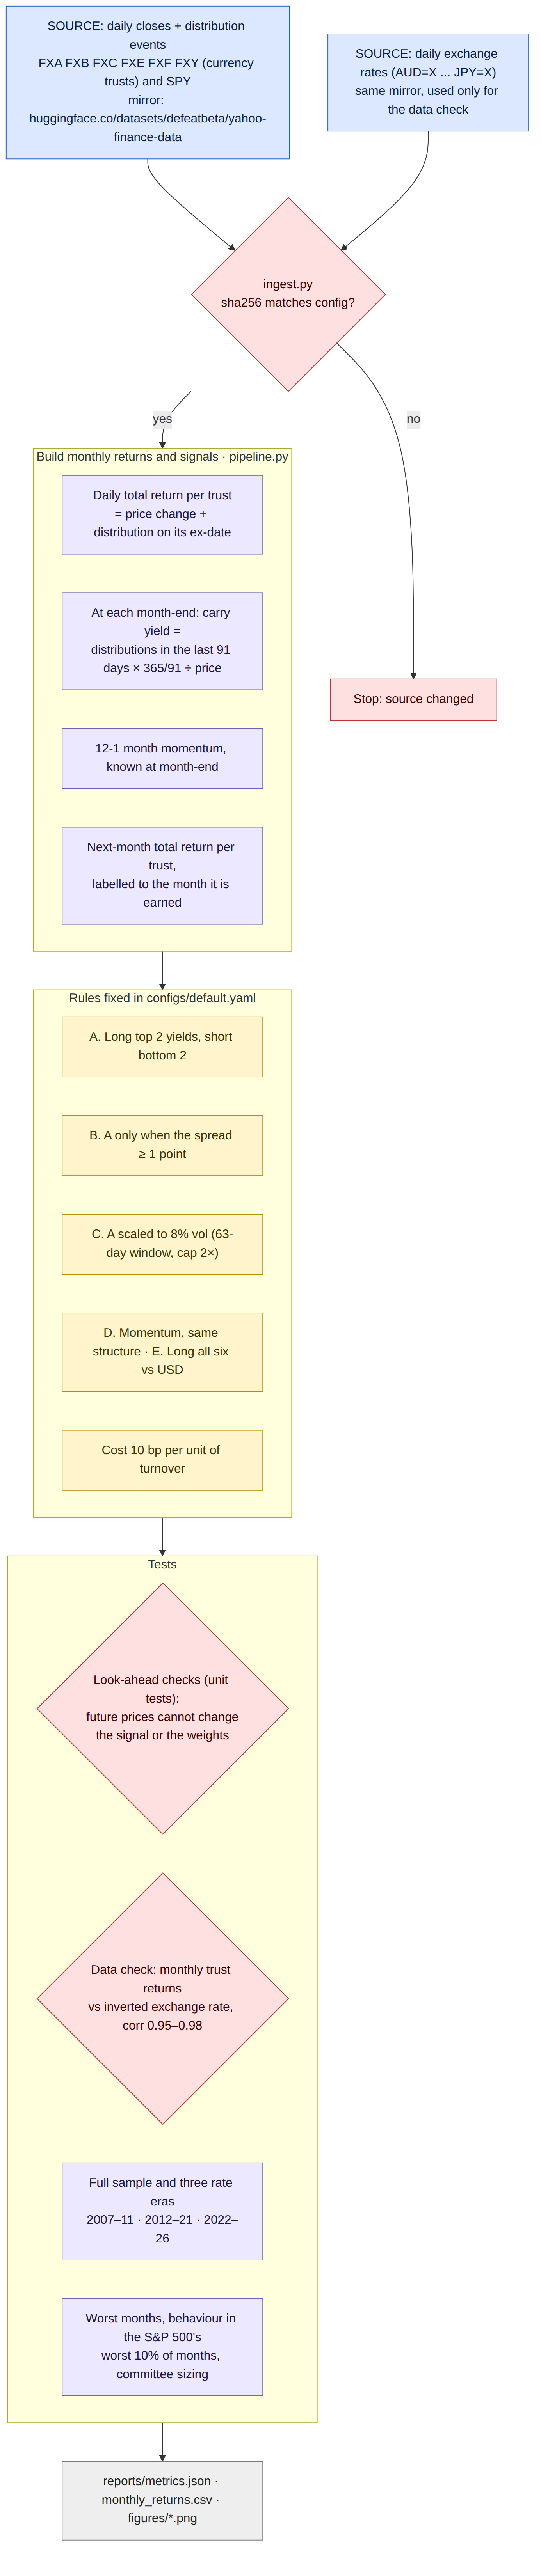
End to end in five steps
| Step | What happens | Output |
|---|---|---|
| 1. Source | Daily closes and distribution records for six currency trusts and SPY; daily exchange rates for a data check; every file checksum-pinned | Raw data with provenance |
| 2. Build | Daily total return per trust (price plus distribution on its ex-date); month-end carry yield and 12-1 momentum, using only data dated on or before the month-end | 235 months of returns and signals |
| 3. Apply rules | Carry; carry with a one-point spread filter; carry scaled to 8% volatility; momentum; long all six against the dollar; 10 bp per unit of turnover | Monthly returns per rule |
| 4. Test | Full sample and three rate eras; worst months and what drove them; behaviour in equity sell-offs; trust returns checked against exchange rates; look-ahead unit tests | Performance and tail statistics |
| 5. Translate | Size the book to 1% of NAV volatility on an illustrative $1bn; replay October 2008 at that size | Committee sizing table |
The data
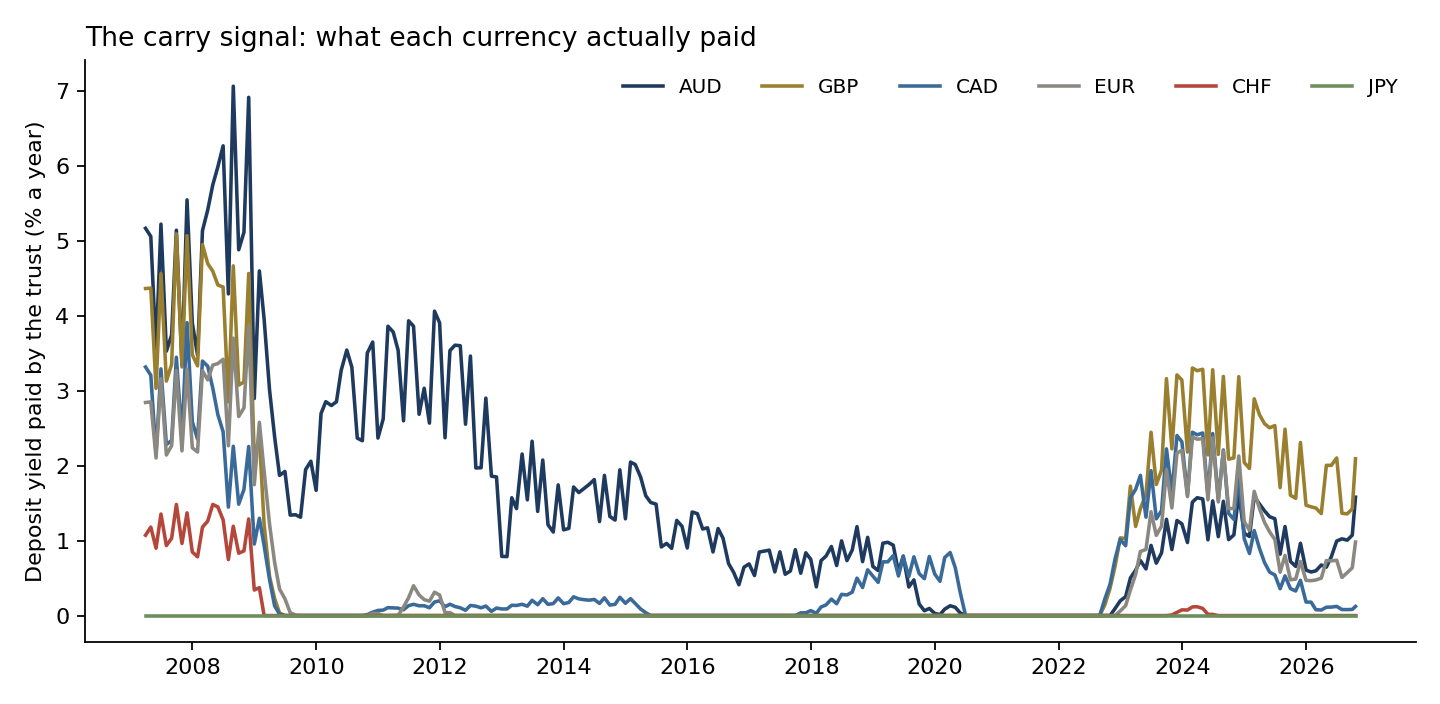
The test uses the Invesco CurrencyShares trusts, each of which holds deposits in one currency and distributes the interest it earns. That choice matters. Academic carry studies usually use forward contracts, which embed the full interbank rate differential. The trusts pay less than interbank rates and paid nothing at all for long stretches, so this is carry as an investor holding a listed product actually experienced it, net of fees. The ranking of currencies is close to what forwards would give; the level of carry is lower.
As a data check, each trust's monthly return was compared with the exchange rate itself. The correlations run from 0.95 (yen) to 0.98 (Australian dollar). They are lower on daily data only because the trust and the exchange rate close at different times of day.
The signals, in plain terms
| Signal | Definition used here | Known at the month-end? |
|---|---|---|
| Carry yield | Distributions with ex-dates in the previous 91 days × 365/91 ÷ month-end price | Yes |
| Yield spread | Average yield of the top two minus the bottom two | Yes |
| Trailing volatility | Volatility of the current book over the last 63 trading days, annualised | Yes |
| Momentum | Total return over the twelve months ending one month before the month-end | Yes |
| Next-month return | Trust total return from this month-end to the next, labelled to the month it is earned | Outcome only |
Every input is dated on or before the trade date. Unit tests change prices after the trade date and confirm that the signals and weights do not move.
What it earned, and when
| Rule, Apr 2007 – Oct 2026 | Return / yr | Volatility | Sharpe | Max drawdown | Worst month |
|---|---|---|---|---|---|
| A. Carry: long top 2 yields, short bottom 2 | 0.62% | 8.4% | 0.07 | −36.7% | −14.4% (Oct 2008) |
| B. A, only when the yield spread is at least 1 point | 0.64% | 7.1% | 0.09 | −36.7% | −14.4% (Oct 2008) |
| C. A, scaled to 8% volatility | 0.63% | 8.4% | 0.08 | −28.4% | −7.6% (Nov 2016) |
| D. Momentum (12-1 month), same structure | −0.56% | 7.2% | −0.08 | −35.4% | −7.9% (Sep 2011) |
| E. Long all six against the dollar | 0.13% | 7.5% | 0.02 | −34.8% | −6.8% (Oct 2008) |
235 months, after 10 bp per unit of turnover. The spread filter (B) was in the market 66% of the time and did not avoid October 2008, when the spread was wide.
The full-sample average is the least useful number in the table. What matters is the regime.
| Era | Average yield spread, top 2 vs bottom 2 | Carry return / yr | Carry Sharpe | Volatility-scaled Sharpe |
|---|---|---|---|---|
| 2007–2011: crisis and normal rates | 3.6 points | 0.06% | 0.00 | 0.12 |
| 2012–2021: zero-rate decade | 1.1 points | −0.53% | −0.07 | −0.15 |
| 2022–2026: rates back | 1.8 points | 3.58% | 0.65 | 0.62 |
In the first era a wide spread was earned and then given back in the 2008 unwind. In the second there was little to earn. The third is the only period in the sample in which carry paid for its risk.
How it breaks
| Worst months, constant book | Carry book | Long legs | Short legs |
|---|---|---|---|
| October 2008 | −14.4% | AUD −15.4%, GBP −9.3% | CHF −3.4%, JPY +7.6% |
| December 2008 | −8.0% | AUD +8.9%, GBP −5.2% | CHF +14.0%, JPY +5.5% |
| November 2016 | −6.7% | AUD −2.9%, JPY −8.4% | GBP +2.2%, CAD −0.2% |
| November 2007 | −5.6% | AUD −4.3%, GBP −0.6% | CHF +2.5%, JPY +3.7% |
| March 2008 | −5.3% | AUD −1.6%, GBP +0.3% | CHF +5.0%, JPY +4.3% |
Currency returns against the US dollar, including deposit interest. In November 2016 several yields were exactly zero and the yen entered the long leg on a tie-break; that loss is an artefact of having nothing to rank, which is the case for the spread filter.
The pattern is the one described in the research literature: carry is long the currencies that fall in a flight to safety and short the ones that rally. In October 2008 the Australian dollar lost 15% and the yen gained 8% in the same month. Three findings matter for a decision. First, the crash is the trade, not an accident around it: four of the five worst months came in the 2007–2008 unwind. Second, it is not a diversifier: in the S&P 500's worst 10% of months the carry book lost 0.9% on average while the index fell 8.0%, and the passive short-dollar basket lost 2.0%. Third, scaling to constant volatility is the cheapest control available: it cut the book before the worst of 2008, because volatility was already rising, and halved the October loss without giving up return.
Recommendations
- Own it as a regime trade. Hold carry while the yield gap between the top and bottom of the ranking is at least one point, and go flat below that. Today's ranking is long sterling (2.1%) and the Australian dollar (1.6%), short the Swiss franc and the yen, which the trusts pay nothing on.
- Run it volatility-scaled. The same return with half the crash month and a shallower drawdown. It is a rule, not a forecast, and it needs no judgment at the moment of stress.
- Size from the crash, not the average. At 1% of NAV in volatility on $1bn, the expected income is about $0.75M a year and the October 2008 replay is about −$9M scaled (−$17M constant). Approve the loss before approving the book.
- Do not net it against equity risk. Count it as risk-on exposure. In equity sell-offs it lost money alongside the index.
- Monitor the crowding signals. Rising currency volatility, a narrowing yield spread and simultaneous losses in other market-neutral books are the conditions under which the unwind has historically started.
Limits
Six currencies is a narrow cross-section; institutional carry books use more currencies, forwards and often emerging markets, where the carry and the crashes are larger. The trusts' deposit rates sit below interbank and policy rates, so the carry level here is lower than in forward-based studies, while the ranking is similar. In the zero-rate decade several yields were exactly zero and the ranking was decided by tie-breaks. The book rebalances monthly with no intramonth stops and no margin model, and the last month is partial (through 19 October 2026). Costs are illustrative. This is independent research on public data; it is not investment advice and the strategy has not been deployed.

Sources
Data
- Invesco CurrencyShares trusts (FXA, FXB, FXC, FXE, FXF, FXY) and SPY daily closes and distribution events, Yahoo Finance. Copy used: huggingface.co/datasets/defeatbeta/yahoo-finance-data (ODC-BY)
- Daily exchange rates (Yahoo Finance), same dataset, used only for the data check
Methods referenced
- Brunnermeier, M., Nagel, S. and Pedersen, L. (2008). "Carry Trades and Currency Crashes." NBER Macroeconomics Annual 23, 313–347. nber.org/papers/w14473
- Lustig, H., Roussanov, N. and Verdelhan, A. (2011). "Common Risk Factors in Currency Markets." The Review of Financial Studies 24(11), 3731–3777.
- Menkhoff, L., Sarno, L., Schmeling, M. and Schrimpf, A. (2012). "Carry Trades and Global Foreign Exchange Volatility." The Journal of Finance 67(2), 681–718.
- Moreira, A. and Muir, T. (2017). "Volatility-Managed Portfolios." The Journal of Finance 72(4), 1611–1644.
Independent research, not investment advice. Dollar figures are illustrative. Analysis, code, charts and text were produced with AI assistance and reviewed by the author.