Volatility forecasts sit under most of the decisions a risk function signs off:
- how big a position may be;
- how much value-at-risk a desk is using;
- how much margin to call;
- what an option is worth.
Risk teams are now being offered deep-learning models for this job. The pitch is that a neural network reading raw market history will find patterns the old models miss. The question for a risk committee is concrete: should it replace a proven model with one of these, and how would it know?
I tested this as a model-risk team would. The incumbents are HAR, a four-parameter regression that has been the academic standard for more than fifteen years, and the VIX, the volatility the options market prices. The challengers are two networks built in PyTorch: an LSTM and a temporal convolutional network (TCN), each reading 60 days of history. Every model was refit each January from 2008 to 2026 and scored on every day of the following year.
Executive summary
The question. Can deep-learning sequence models forecast next-month S&P 500 volatility better than HAR and the VIX? Does any gain survive when the forecast is used to size a real book?
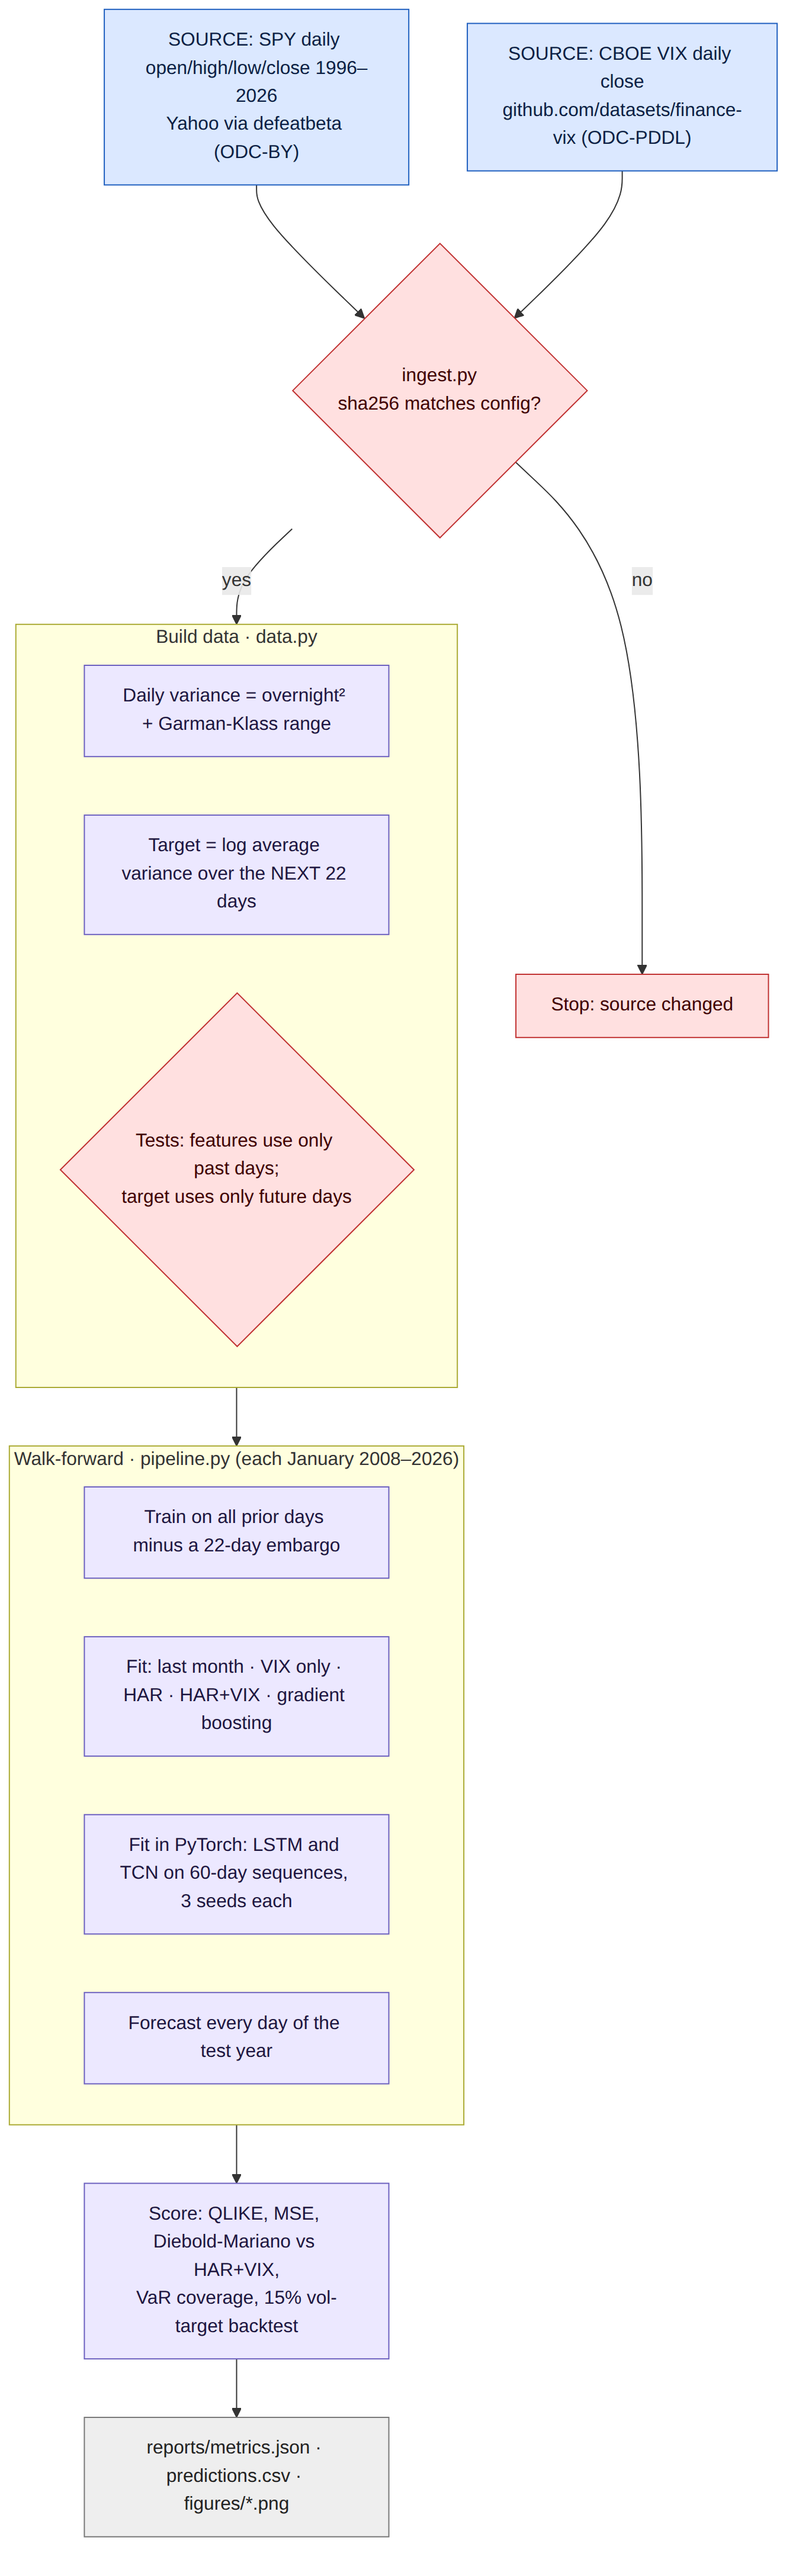
The approach. I built a daily variance estimate from SPY's open, high, low and close for 1996–2026, alongside the CBOE VIX. The target is average daily variance over the next 22 trading days. Seven forecasters were compared:
- last month's realised volatility;
- the VIX alone;
- HAR;
- HAR with the VIX and a leverage term;
- gradient boosting on the same inputs;
- an LSTM;
- a TCN.
Every January from 2008 each model was refit on all earlier data, with a 22-day gap so no training target overlapped the test year. The networks were averaged over three random seeds, and nothing was tuned on the test years. Forecasts were scored with QLIKE and a Diebold–Mariano test. They were then put to work: sizing a 15% volatility-targeted S&P 500 book, and setting a 99% one-day VaR.
The answer. HAR plus the VIX had the lowest loss, and plain HAR was statistically tied with it. The LSTM's loss was 20% higher and the TCN's 38% higher, both significant. The networks won calm years and lost the crises, under-forecasting the most exactly when it mattered most. For sizing, every forecast roughly halved the index's drawdown. The simplest estimate kept the book closest to its target, and the LSTM was the worst of the forecasters.
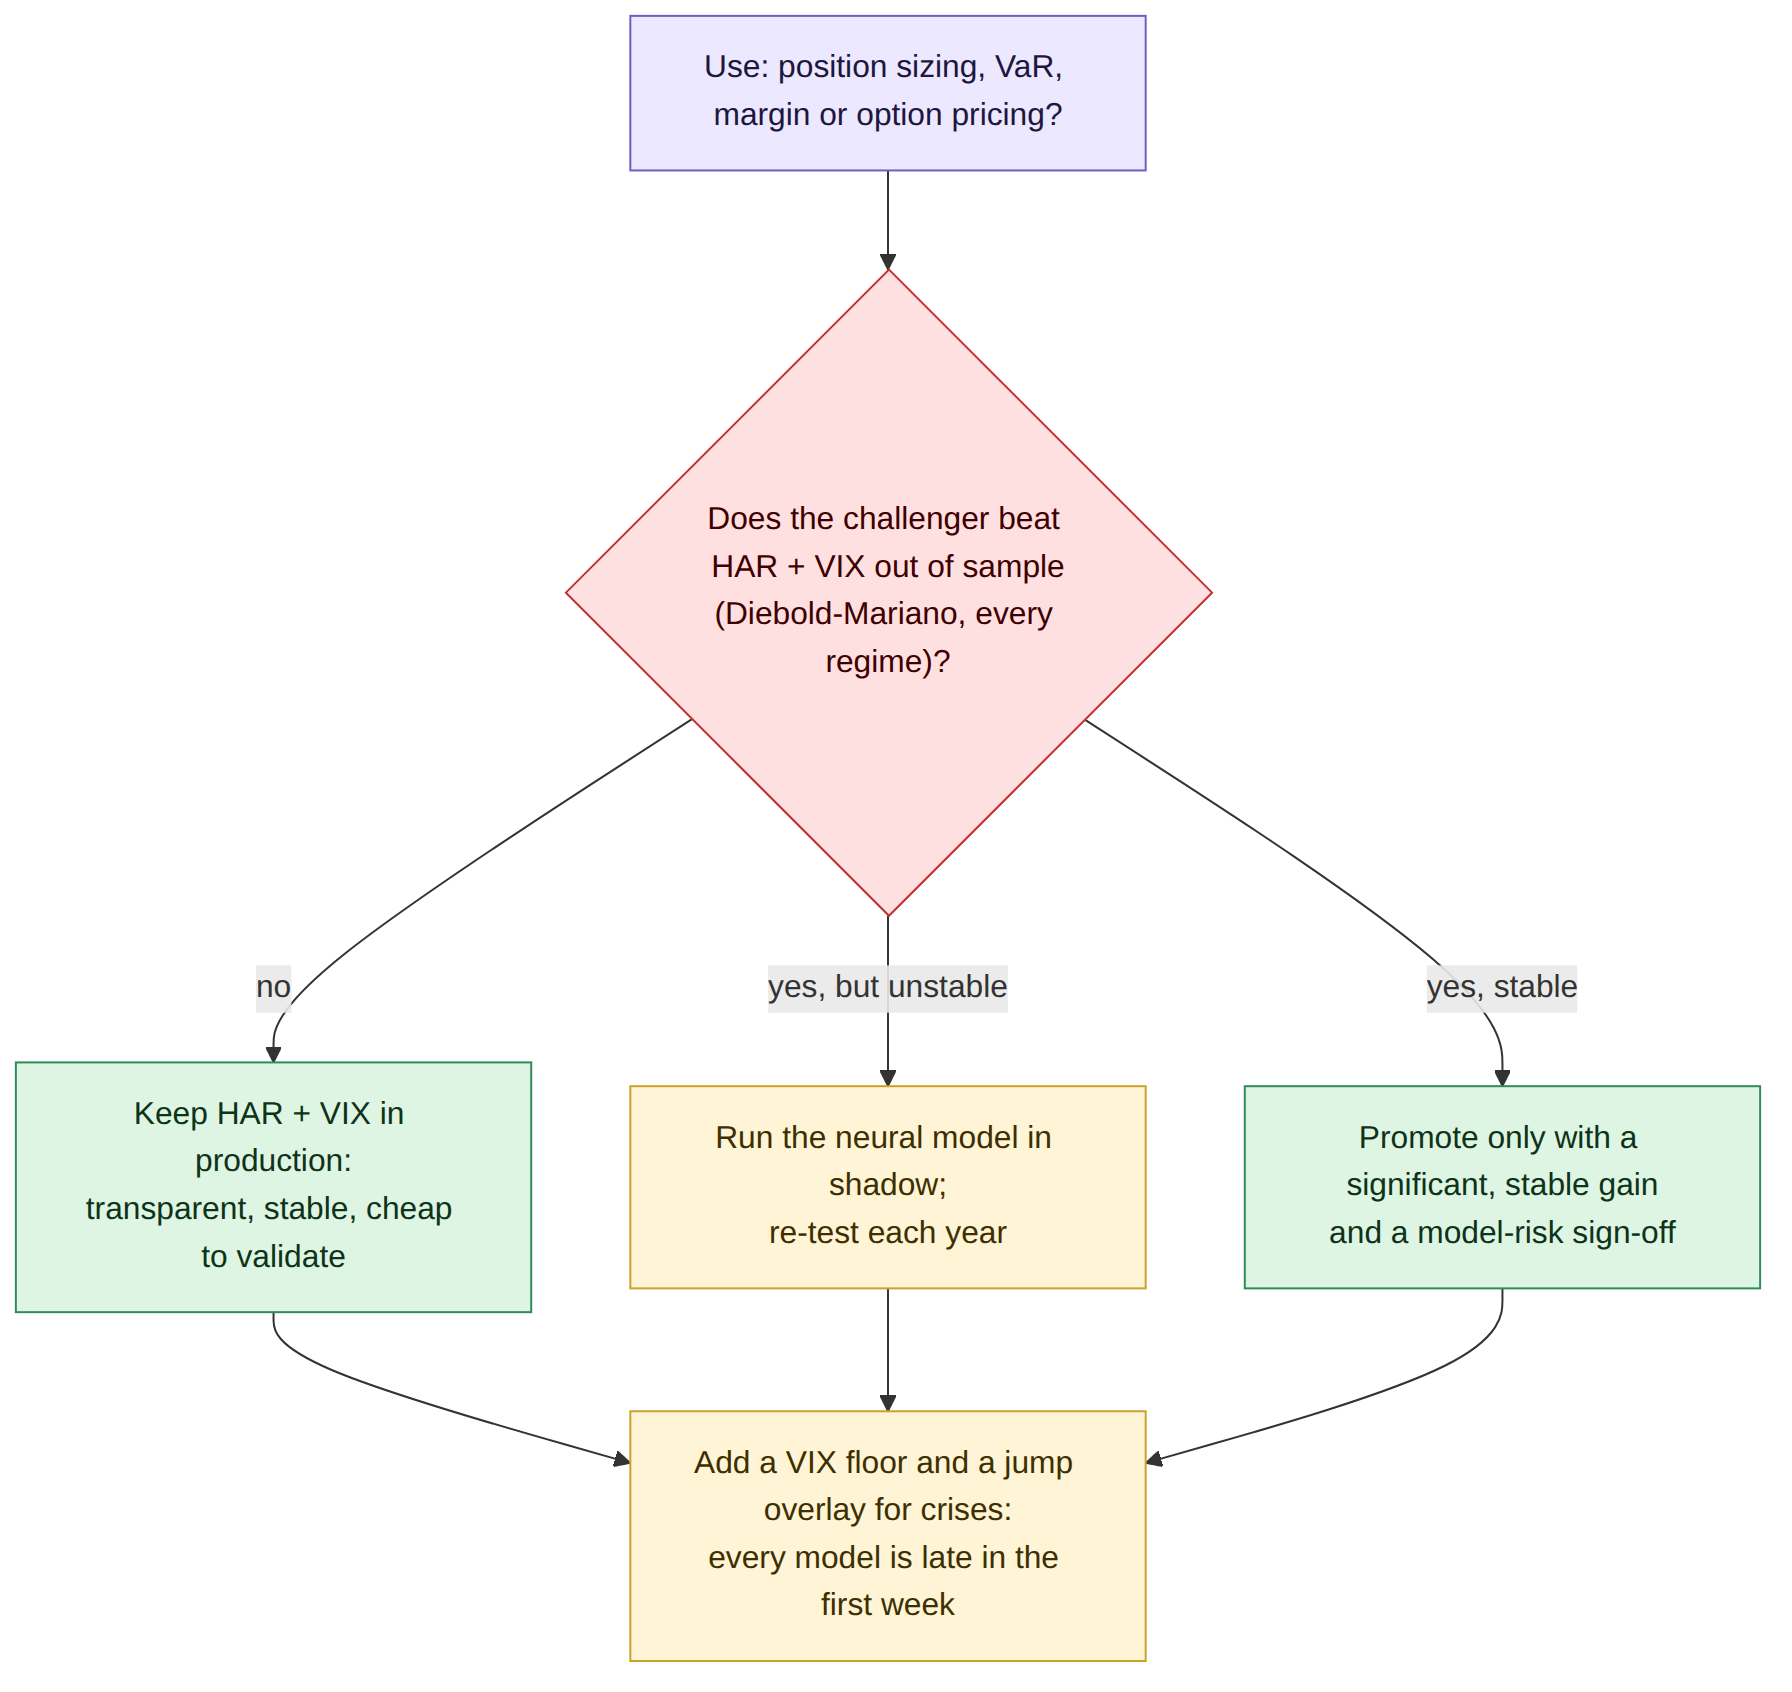
The decision it supports. Keep HAR plus the VIX as the production forecaster. Run neural models only as challengers in shadow, and promote one only on a significant, stable out-of-sample gain across regimes. Judge every forecaster by the decision it drives, not by its fit. Back all of them with a stress overlay, because none of them sees a crash coming.
Business outcomes
| Decision | HAR + VIX | LSTM | What it means |
|---|---|---|---|
| Forecast loss (QLIKE), 2008–2026 | 0.325 (best) | 0.392 (+20%; DM t = 2.6) | The challenger is worse, not just untested |
| Years better than the other | 12 of 19 | 7 of 19, all calm | It loses when losses are largest |
| Average error when realised vol is above 30% (337 days) | 13.6 points too low | 19.0 points too low | A deeper under-call in exactly the days that matter |
| 99% one-day VaR breaches (target 1%) | 1.5% | 2.0% | Both under-cover; the LSTM by more |
| 15% vol-targeted book: worst drawdown | −32.6% | −34.2% | Buy and hold lost 53.0% |
| 15% vol-targeted book: average yearly miss vs target | 1.8 points | 2.1 points | The trailing-month estimate was closest at 1.2 |
| Compute for 19 annual refits | Seconds | About 36 minutes on 2 CPU threads (all models) | Cheap to test; costly to validate and govern |
Out-of-sample, January 2008 to August 2026, 4,688 days. QLIKE uses realised next-month variance; DM = Diebold–Mariano with Newey–West errors. Vol-targeted book: SPY sized to 15% using each forecast, weekly rebalance, leverage cap 2, 2 bp per unit of turnover. Sizing with the LSTM rather than plain HAR deepened the worst drawdown from 30.3% to 34.2%, $38M per $1bn (illustrative).
End to end in five steps
| Step | What happens | Output |
|---|---|---|
| 1. Source | SPY daily open, high, low and close; CBOE VIX daily close; both checksum-pinned | 30 years of daily data |
| 2. Measure | Daily variance = overnight move squared + Garman–Klass range; target = average over the next 22 days | 7,684 days with features and target |
| 3. Fit | Each January from 2008, refit seven forecasters on all prior days, minus a 22-day gap; networks in PyTorch, three seeds each | 19 refits per model |
| 4. Score | QLIKE, MSE, Diebold–Mariano against HAR + VIX, year-by-year and stress-day errors | Which forecaster is better, and when |
| 5. Use | Size a 15% volatility-targeted S&P 500 book; set a 99% one-day VaR | Drawdown, tracking to target, tail coverage |
The data
SPY's daily open, high, low and close come from Yahoo Finance in a public mirror. The CBOE VIX comes from a public-domain copy of Cboe's own history file. Both files are pinned by checksum. The sample runs from March 1996 to September 2026. The out-of-sample test covers January 2008 to August 2026: 4,688 days, including the financial crisis, the 2015 and 2018 volatility shocks, COVID, the 2022 rate shock and the 2025 tariff selloff.
The models, in plain terms
| Model | What it uses | How it learns |
|---|---|---|
| Last month | Average variance over the past 22 days | Nothing to fit: tomorrow looks like last month |
| VIX only | The options market's 30-day implied volatility | One regression coefficient |
| HAR | Variance yesterday, last week and last month | Linear regression: volatility has long memory |
| HAR + VIX | HAR plus the VIX plus recent negative returns (volatility rises more after falls) | Linear regression, seven coefficients |
| Gradient boosting | The same inputs as HAR + VIX | Hundreds of small decision trees |
| LSTM | The last 60 days of variance, VIX and returns, day by day | A recurrent network that carries a memory forward through the sequence |
| TCN | The same 60-day sequence | Stacked causal convolutions whose reach doubles at each layer |
All forecasts target the log of next-month variance and are converted back with a bias correction estimated in training. The networks were trained in PyTorch on CPU with settings fixed before any results were seen.
What happened
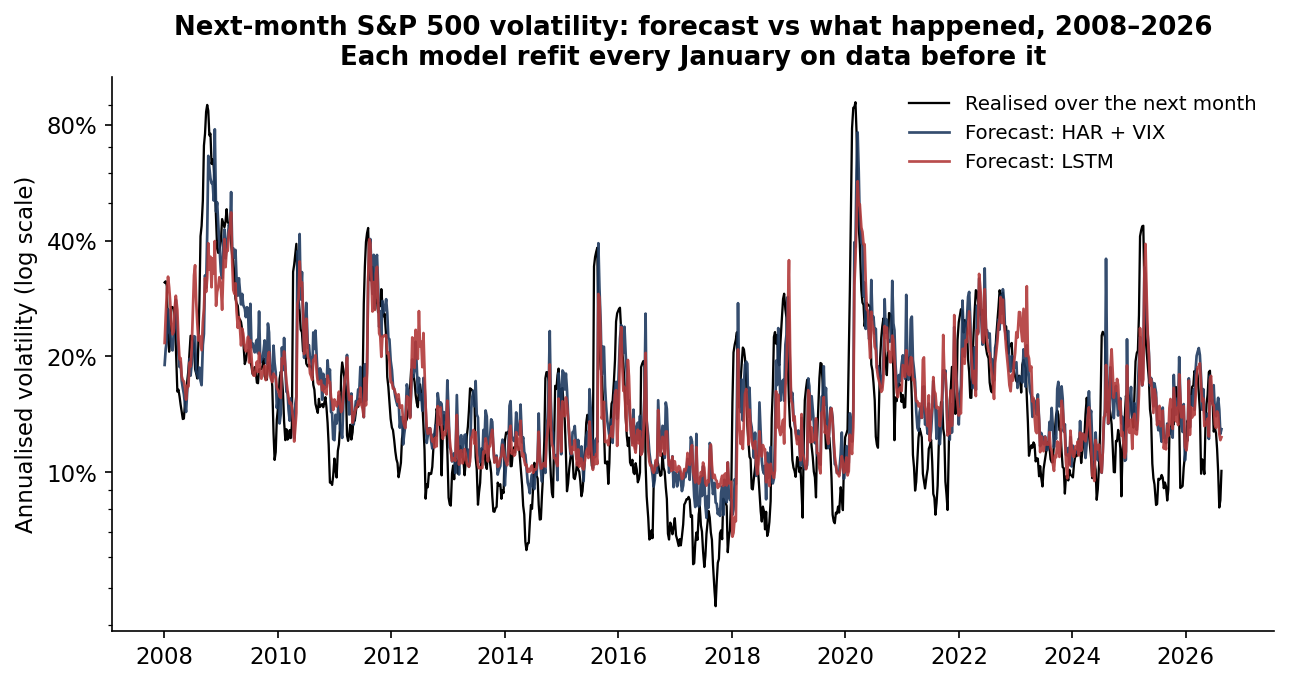
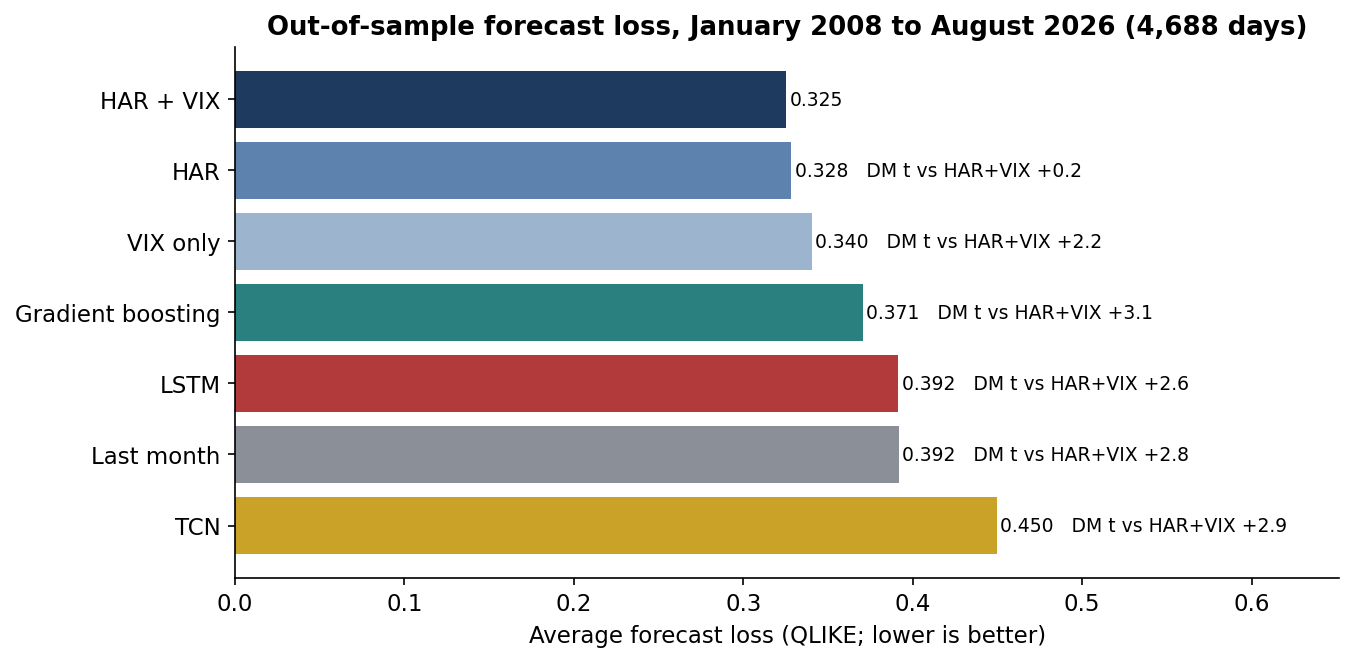
Two results matter. First, the classic model was not just competitive; it was best. Adding the VIX and a leverage term to HAR made the forecast more accurate, but the gain over plain HAR was small and not significant. The VIX on its own was close behind. The networks, given more flexibility and the same information, did worse.
Second, the networks did not lose evenly. The LSTM beat HAR + VIX in seven years: 2009, 2013, 2014, 2016, 2019, 2024 and 2026 to date. Those are calm, trending years, when volatility drifts and memory is enough. It lost heavily in the stress years: by 32% in 2008, 18% in 2015, 73% in 2018 and 25% in 2020. On the 337 days when realised volatility was above 30%, it under-forecast by 19.0 points on average, against 13.6 for HAR + VIX.
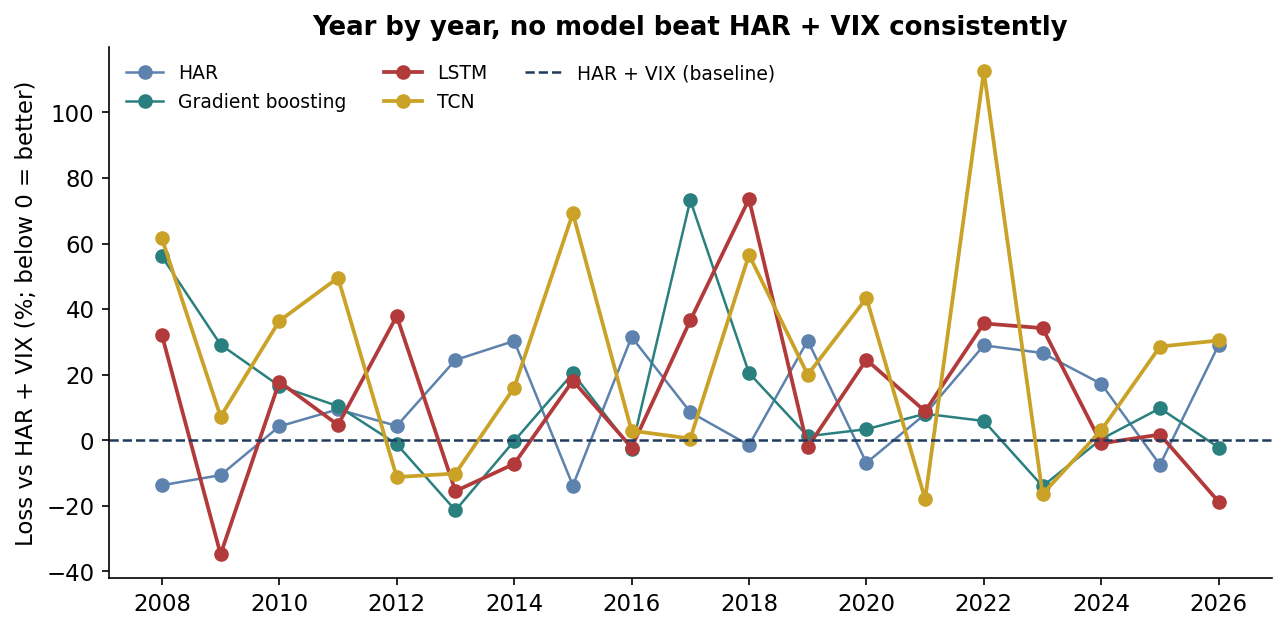
Why? Thirty years of daily data sounds like a lot, but the targets overlap. The effective sample is closer to 350 independent months, and only a handful of them are crises. A network has to learn volatility's long memory from scratch, while HAR is handed it as three numbers. In calm markets the network's extra flexibility fits small patterns. In a shock, it has seen too few to know how far volatility can go.
Using the forecast
A forecast is only worth what the decision built on it is worth. I used each one to size an S&P 500 position to a 15% volatility target, rebalanced weekly, with leverage capped at two times and a small trading cost.
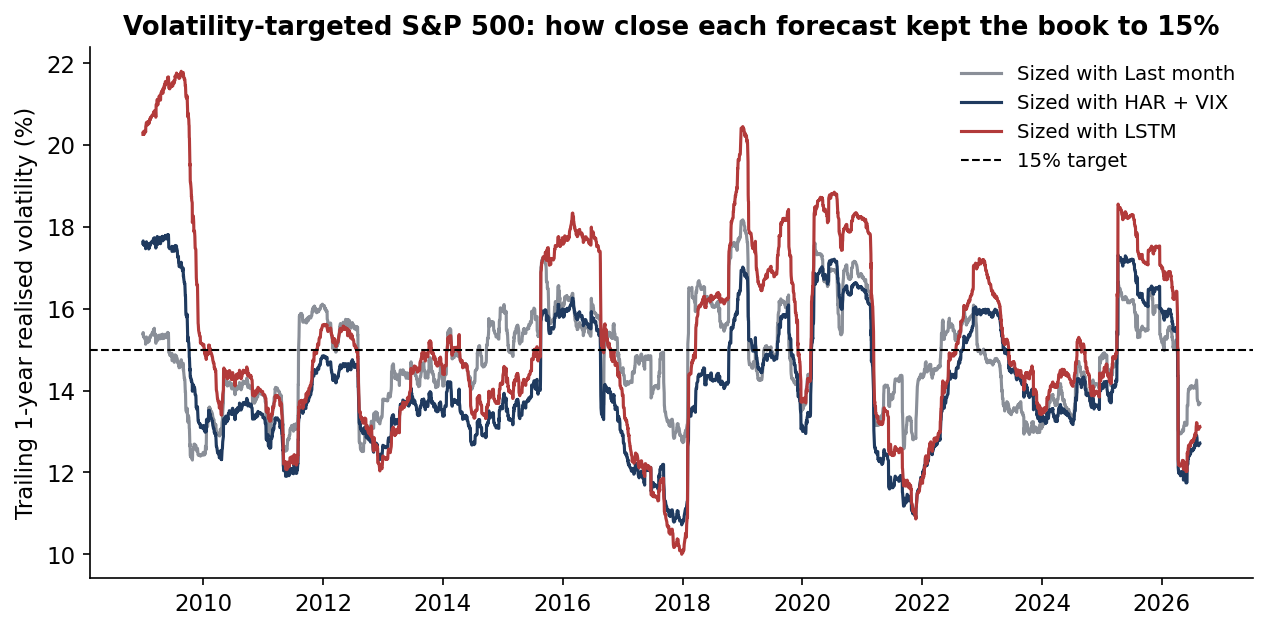
| 15% target book, sized with… | Return a year | Volatility | Sharpe | Worst drawdown | Average yearly miss vs 15% | 99% VaR breach rate |
|---|---|---|---|---|---|---|
| Buy and hold (no target) | 9.0% | 19.8% | 0.45 | −53.0% | 6.0 pts | n/a |
| Last month's realised | 8.0% | 14.8% | 0.54 | −28.0% | 1.2 pts | 2.0% |
| HAR | 8.0% | 14.5% | 0.55 | −30.3% | 1.7 pts | 1.7% |
| HAR + VIX | 7.6% | 14.3% | 0.53 | −32.6% | 1.8 pts | 1.5% |
| LSTM | 7.9% | 15.4% | 0.51 | −34.2% | 2.1 pts | 2.0% |
| TCN | 8.2% | 16.1% | 0.51 | −36.3% | 2.0 pts | 2.5% |
SPY price returns, January 2008 to August 2026. VaR: one-day 99% from each forecast assuming normal returns; 1% is the target breach rate.
Any of the forecasts beat doing nothing: volatility targeting cut the worst drawdown from 53% to between 28% and 36% and lifted the Sharpe ratio. Among the forecasts, three points stand out.
- The most accurate forecast was not the best sizing tool. The trailing-month estimate kept realised volatility closest to target and had the shallowest drawdown. It also reacts to realised volatility and nothing else, which is what a target book needs.
- The neural forecasts sized worst. The LSTM deepened the worst drawdown by 3.8 points against plain HAR, $38M per $1bn.
- No forecast covered the tails. A normal 99% VaR built on any of them was breached between 1.5% and 2.5% of the time. VaR needs a fat-tail or stress add-on whichever forecaster sits underneath.
The commercial case
The product here is not a better forecaster. It is a challenger lab: a standard, reproducible way to test any proposed volatility or risk model against a strong baseline before it reaches production. Model-risk rules already expect challengers, and risk teams are being pitched machine-learning models every week.
| Element | What it is | Basis |
|---|---|---|
| Who pays | Model-risk and validation teams at banks and insurers; CROs at asset managers and hedge funds; volatility-targeting and risk-parity product teams | Budget holders: head of model risk, CRO, head of quant |
| The problem in dollars | $38M deeper worst drawdown per $1bn from sizing with the LSTM instead of HAR; on stressed days about $7.9M per $1bn of understated one-day VaR against HAR + VIX | Drawdown 34.2% vs 30.3%; 5.4 vol points ÷ √252 × 2.326 |
| The product | A walk-forward challenger harness: embargoed refits, seed averaging, QLIKE and Diebold–Mariano, decision tests for sizing and VaR, and a validation report a committee can sign | This repository is the working prototype |
| Proof | 7 models, 19 annual refits, 4,688 out-of-sample days, every number reproducible | Public code and data |
| Build vs buy | 6–8 weeks to wrap the harness around a client's data and models with one quant and one engineer; today many teams validate model by model, by hand | Illustrative effort |
| Pricing logic | $40–80k per model validation, or $150k a year for a standing challenger service | Illustrative; small against one avoided $38M drawdown |
| What could stop adoption | Access to the client's models and data; independence requirements for validation | Mitigation: run inside the client's environment |
| How a client judges it | Models stopped before production, time to validate, VaR coverage, significance of any promoted gain | Reported per model |
All prices and effort figures are illustrative assumptions with their arithmetic shown. Value figures come from this project's results; they are not a forecast for any firm.
The commercial point mirrors the risk point. The value is in the discipline that stops a weaker model reaching production, more than in any single clever model.
Recommendations
- Keep HAR + VIX as the production volatility forecaster. It was the most accurate, it is transparent, and its handful of coefficients can be validated and explained to a committee.
- Run neural models as shadow challengers. Re-test them each year on the same walk-forward design. Promote only on a significant gain that holds in stress years, not just on average.
- Choose the forecaster by the decision. For volatility targeting, a responsive trailing estimate kept the book closest to target. For VaR and margin, a forward-looking input like the VIX matters more.
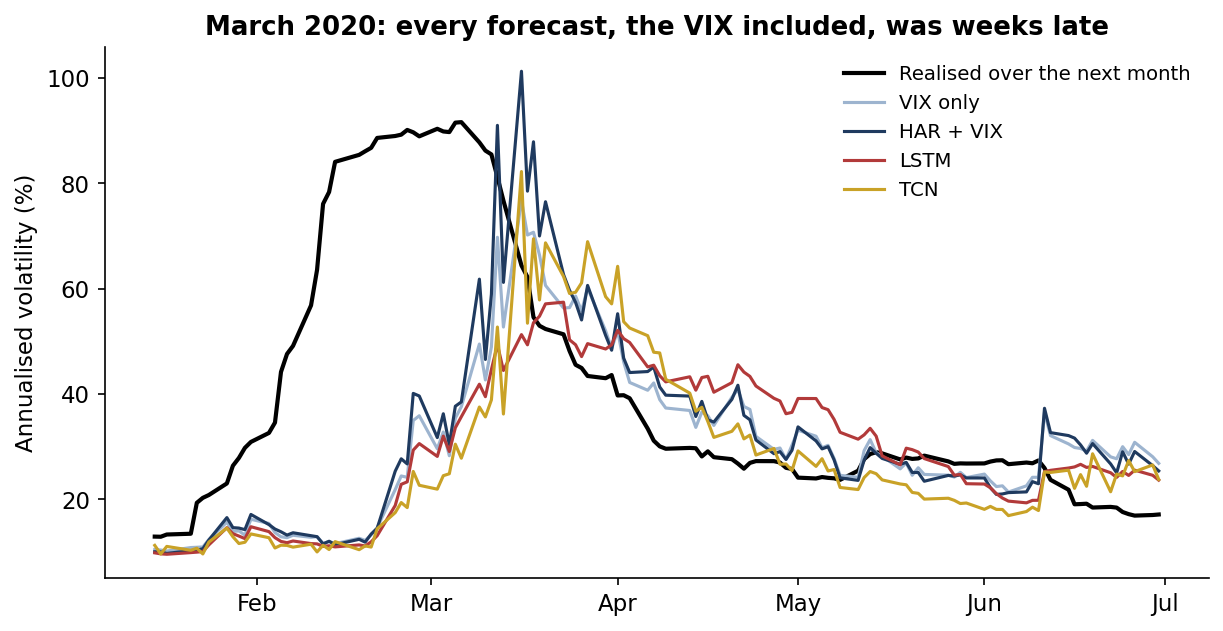
- Put a stress overlay above every forecast. Every model was weeks late in March 2020. Add a VIX-jump trigger, a minimum volatility floor in sizing, and limits that do not depend on the model.
- Add a fat-tail adjustment to VaR. Normal VaR on any of these forecasts breached 50% to 150% too often.
- Govern neural models like any other model. Fix seeds and report the spread across them, keep the training window and embargo in code, and keep a strong simple baseline as the benchmark it must beat.
Limits
- Daily data only. The variance measure comes from daily prices, not intraday trades. Neural networks may do better with intraday data or many assets at once; that needs its own pre-registered test.
- One index, one horizon. The test covers the S&P 500 at a one-month horizon.
- Settings fixed in advance. Network settings were not tuned on the test years. A tuned network might look better in a backtest, which is exactly what a validator should distrust.
- Simplified backtest. The volatility-targeting test uses price returns and ignores dividends and financing.
- Independent research. This is independent research on public data. It has not been deployed and is not investment advice.
Sources
Data
- SPY daily open, high, low and close: Yahoo Finance. Copy used: huggingface.co/datasets/defeatbeta/yahoo-finance-data (ODC-BY).
- CBOE Volatility Index (VIX), daily: Cboe Global Markets. Copy used: github.com/datasets/finance-vix, data/vix-daily.csv (ODC-PDDL-1.0), downloaded 28 October 2026.
Methods referenced
- Corsi, F. (2009). "A Simple Approximate Long-Memory Model of Realized Volatility." Journal of Financial Econometrics, 7(2), 174–196. ideas.repec.org/a/oup/jfinec/v7y2009i2p174-196.html
- Garman, M. B. and Klass, M. J. (1980). "On the Estimation of Security Price Volatilities from Historical Data." Journal of Business, 53(1), 67–78.
- Hochreiter, S. and Schmidhuber, J. (1997). "Long Short-Term Memory." Neural Computation, 9(8), 1735–1780.
- Bai, S., Kolter, J. Z. and Koltun, V. (2018). "An Empirical Evaluation of Generic Convolutional and Recurrent Networks for Sequence Modeling." arXiv:1803.01271.
- Patton, A. J. (2011). "Volatility Forecast Comparison Using Imperfect Volatility Proxies." Journal of Econometrics, 160(1), 246–256.
- Diebold, F. X. and Mariano, R. S. (1995). "Comparing Predictive Accuracy." Journal of Business & Economic Statistics, 13(3), 253–263.
- Bucci, A. (2020). "Realized Volatility Forecasting with Neural Networks." Journal of Financial Econometrics, 18(3), 502–531. ideas.repec.org
- Christensen, K., Siggaard, M. and Veliyev, B. (2023). "A Machine Learning Approach to Volatility Forecasting." Journal of Financial Econometrics, 21(5), 1680–1727. ideas.repec.org
- Moreira, A. and Muir, T. (2017). "Volatility-Managed Portfolios." Journal of Finance, 72(4), 1611–1644. nber.org/papers/w22208
Independent research on public data, not investment advice; dollar figures are illustrative. Analysis, code, charts and text were produced with AI assistance and reviewed by the author.