High-yield bonds sit in most multi-asset portfolios: in pension and endowment credit sleeves, in insurers' general accounts, and in the model portfolios of wealth platforms. The usual case for them has two parts. They pay more than Treasuries, and they diversify an equity book.
Both claims can be tested. A high-yield bond is a loan to a company that might default, so part of its return should move with that company's stock. Part should move with Treasury rates, because the coupons are fixed. Whatever is left over is the return for bearing credit risk itself. That residual is what an allocator is really paying for. If it is small, a cheaper, more liquid mix of stocks and Treasuries could do the same job.
I tested this on the SPDR Bloomberg High Yield Bond ETF (JNK), the high-yield fund with the longest daily history in the public data used here. The test runs monthly from December 2007 to September 2026, with dividends included.
Executive summary
The question. How much of a high-yield fund's return is equity risk and Treasury risk in disguise? Is anything left for credit risk itself? Could a simple portfolio of stocks and Treasuries, sized only on past data, have done the same job?
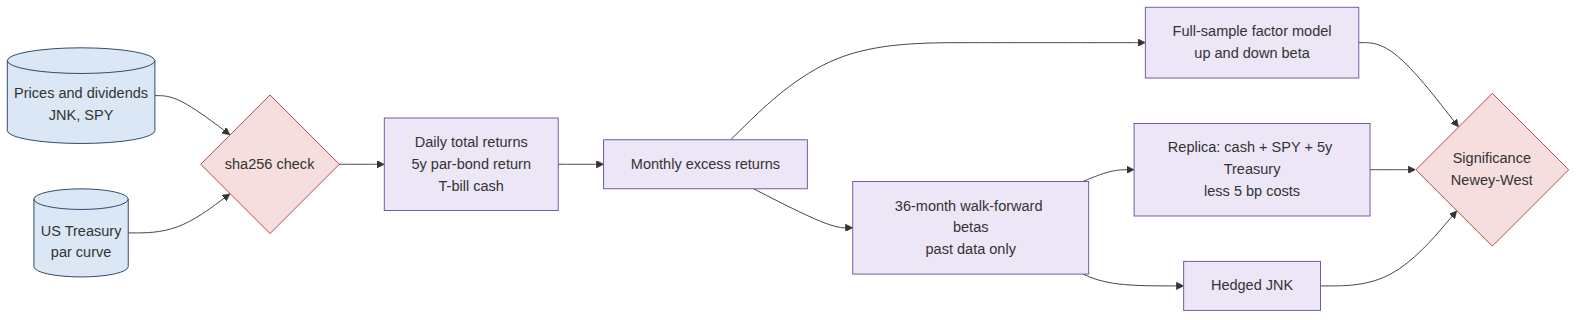
The approach. I built monthly total returns for JNK and the S&P 500 (SPY), with dividends, from the public Yahoo Finance record. Alongside them I built the return of a constant-maturity 5-year Treasury from the official daily par yield curve, and 3-month T-bills as cash. Then I ran three tests:
- a factor regression of JNK's excess return on stock and Treasury excess returns, with up and down betas;
- a replica: each month, hold cash plus SPY and the 5-year Treasury in the proportions estimated over the previous 36 months only, less trading costs;
- the hedged fund: JNK minus that same equity and Treasury exposure, which is what an allocator would keep after hedging the betas.
The answer. JNK behaved like about 55% stocks and 26% Treasuries. The equity share rose to 73% in falling markets. The replica beat the fund by 3.0 points a year, with lower volatility and a smaller worst drawdown. It was ahead in 11 of 16 years and in all three five-year sub-periods. Hedged, the fund returned −1.3% a year, below cash. In one fund and one period, the credit risk itself was not paid.
The decision it supports. Treat high-yield holdings as equity and rate risk first. Count the equity beta in risk budgets, and use the down-market beta in stress tests. Hold high yield where it earns something beyond its betas, after fees: for example, through a manager whose residual return is positive over full cycles. Otherwise replicate the exposure more cheaply.
Business outcomes
| Decision | High-yield ETF (JNK) | Equity + Treasury replica | What it means |
|---|---|---|---|
| Annual return, Dec 2010 – Sep 2026 | 4.7% | 7.7% (net of 5 bp costs) | 3.0 points a year more for the same exposures; t = −2.5 |
| Volatility | 7.7% | 7.0% | The replica was no riskier |
| Worst drawdown | −16.2% | −13.0% | Smaller loss at the worst point |
| Sharpe ratio | 0.40 | 0.88 | More than twice the return per unit of risk |
| Years ahead | 5 of 16 | 11 of 16 | Not one lucky stretch |
| Average month when stocks fell more than 5% (17 months) | −3.4% | −3.0% | Both fall; the fund slightly more |
| Hedged return (fund minus its betas) | −1.3% a year | n/a | Below cash (1.6%): no reward for the credit risk itself |
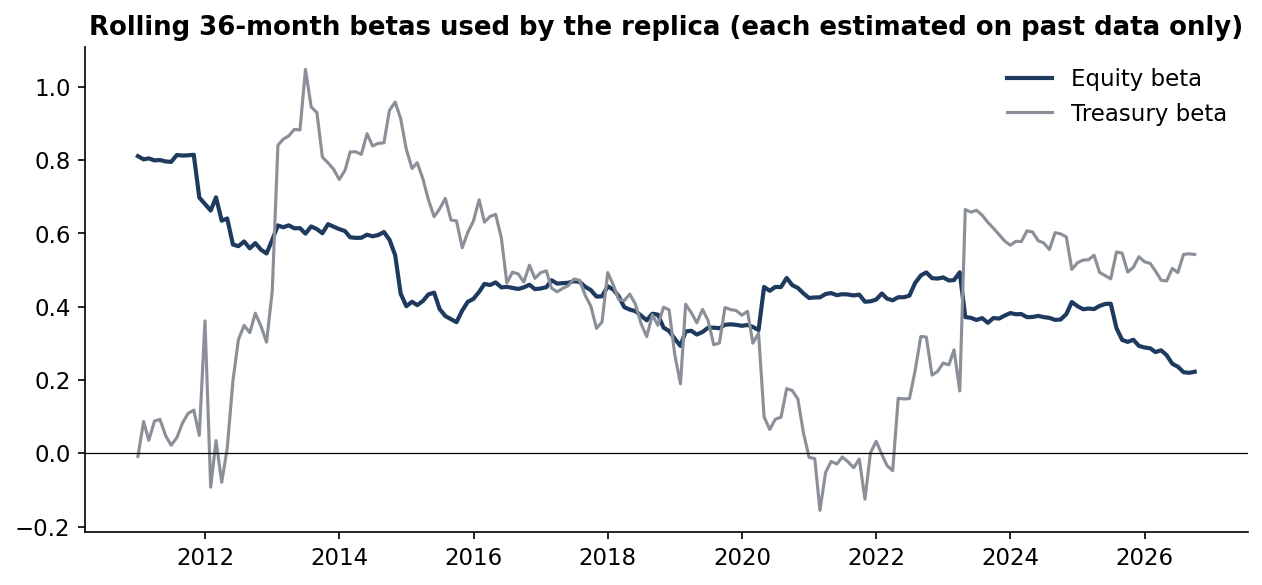
Replica weights each month are the betas from the prior 36 months only: on average 0.46 in SPY and 0.42 in the 5-year Treasury, the rest in cash, no leverage. Correlation with JNK 0.81; tracking error 4.6% a year. On a $1bn allocation the 3.0-point gap is about $30M a year (illustrative; a past gap is not a forecast).
End to end in five steps
| Step | What happens | Output |
|---|---|---|
| 1. Source | JNK and SPY daily prices and dividends; the US Treasury daily par yield curve; all checksum-pinned | Daily data, Dec 2007 – Oct 2026 |
| 2. Measure | Daily total returns with dividends; a constant-maturity 5-year Treasury return from the par curve (carry − duration × yield change + convexity); 3-month bills as cash | Monthly excess returns, 226 months |
| 3. Decompose | Regress JNK's excess return on SPY and Treasury excess returns, with Newey–West errors; split up and down months | Betas, residual, R² |
| 4. Replicate | Each month, set weights from the prior 36 months only; charge 5 bp per unit of weight change | Walk-forward replica, Dec 2010 – Sep 2026 |
| 5. Judge | Compare return, risk, drawdowns, years ahead, sub-periods and stress episodes; test the gap | Is the credit risk paid? |
The data
The fund and equity returns are daily prices and dividend events from the public Yahoo Finance record, mirrored on Hugging Face. The Treasury leg comes from the U.S. Treasury's daily par yield curve in the same dataset. Each file is pinned by checksum, so anyone can confirm they are using the same numbers.
JNK started trading in late 2007, so the sample opens just before the financial crisis. That is useful, because the test includes several stress episodes: 2008, the 2011 euro crisis, the 2015–16 energy bust, late 2018, March 2020 and the 2022 rate shock.
The Treasury leg is a constructed constant-maturity bond, not a traded fund. Its daily return is the previous day's yield accrued, minus the change in yield times the bond's duration, plus a convexity term. A unit test checks the arithmetic: a 1-point rise in a 5-year par yield costs about 4.4%.
What a high-yield ETF is made of
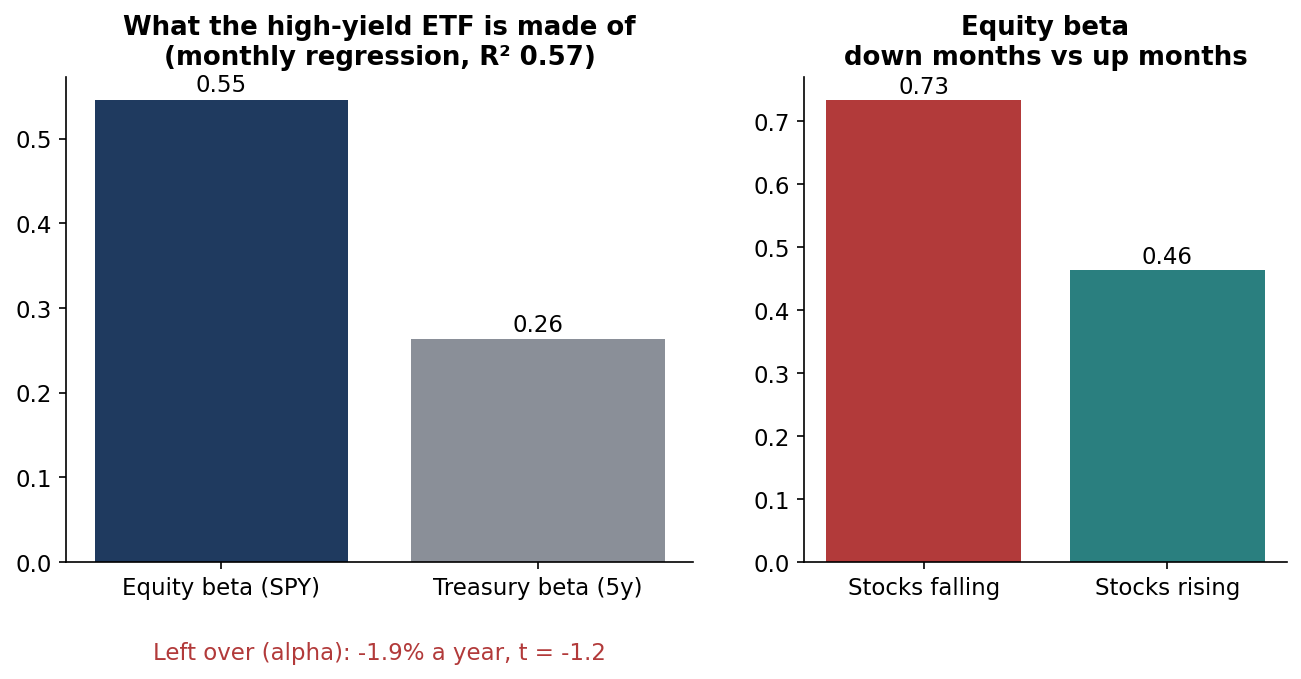
Two things stand out. First, the equity share is large: more than half of the fund's month-to-month movement lines up with the S&P 500. Merton's model of corporate debt predicts this, because a risky bond is economically a safe bond minus a put option on the firm. As the firm weakens, the bond behaves more like its stock.
Second, the beta is asymmetric. In months when stocks rose, JNK captured less than half of the move. In months when they fell, it captured nearly three-quarters. That is the payoff of a short put, and it means the average beta understates the risk that matters.
The replica
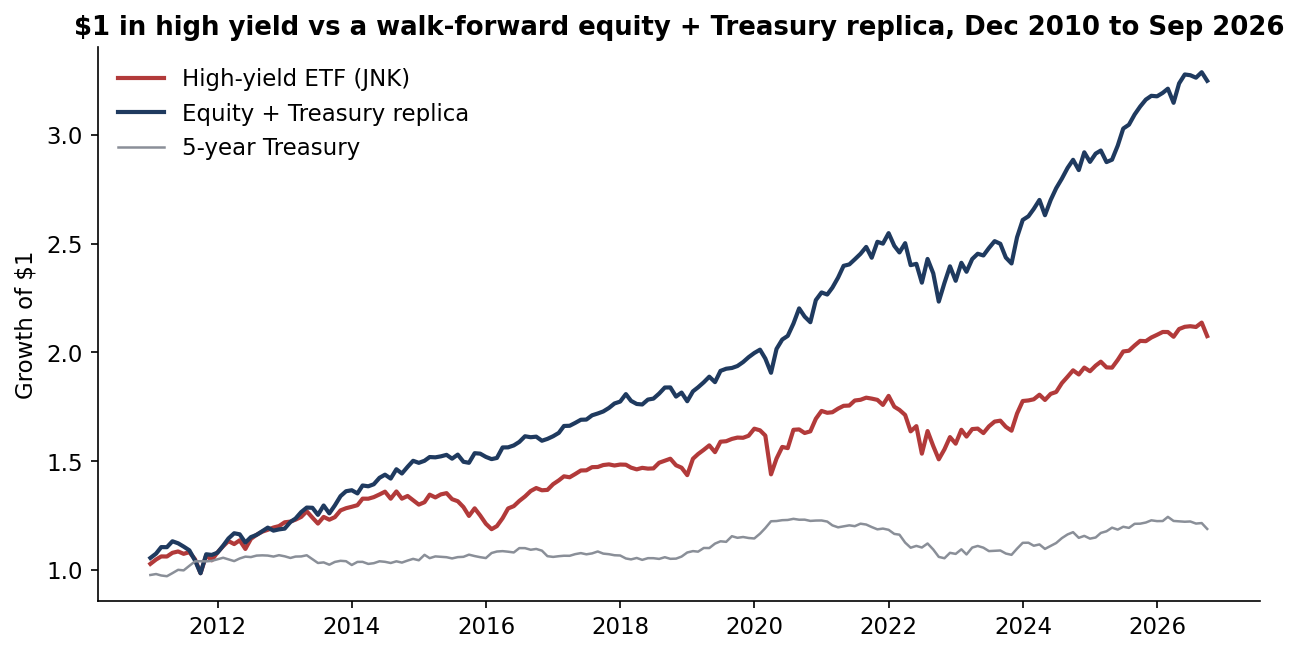
The replica is deliberately simple. Each month it estimates JNK's equity and Treasury betas over the previous three years. It then holds those weights in SPY and the 5-year Treasury, with the rest in T-bills. On average that meant 46% in stocks and 42% in Treasuries. It never used leverage and never saw the future.
| Sub-period | JNK | Replica | JNK hedged |
|---|---|---|---|
| 2011–2015 | 3.4% | 7.6% | −4.0% |
| 2016–2020 | 7.4% | 8.4% | 0.2% |
| 2021–2026 | 3.2% | 6.4% | 0.3% |
Annual returns. The 2011–2015 gap is the largest because of the 2015–16 energy bust, a genuinely credit-specific loss.
Stress episodes
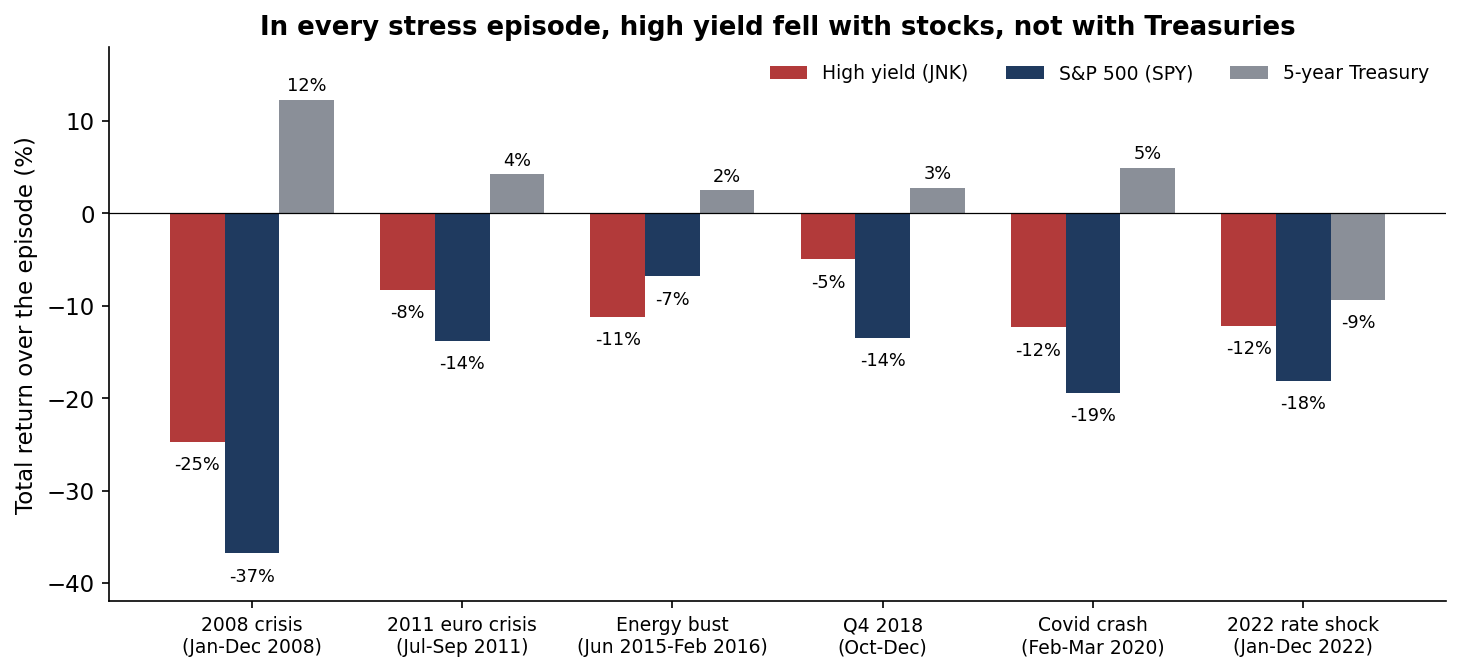
The pattern is consistent. In 2008 JNK lost 25% while Treasuries gained 12%. In March 2020 it lost 12% while Treasuries gained 5%. As a diversifier for an equity book, high yield failed exactly when diversification was needed.
The one episode where high yield did worse than stocks was the 2015–16 energy bust: JNK lost 11% against 7% for SPY. Energy issuers were a large share of the high-yield market and defaults rose. That is credit risk proper, and it is the risk the coupon is supposed to pay for. In this sample, the extra coupon did not cover it.
What is left after the hedge
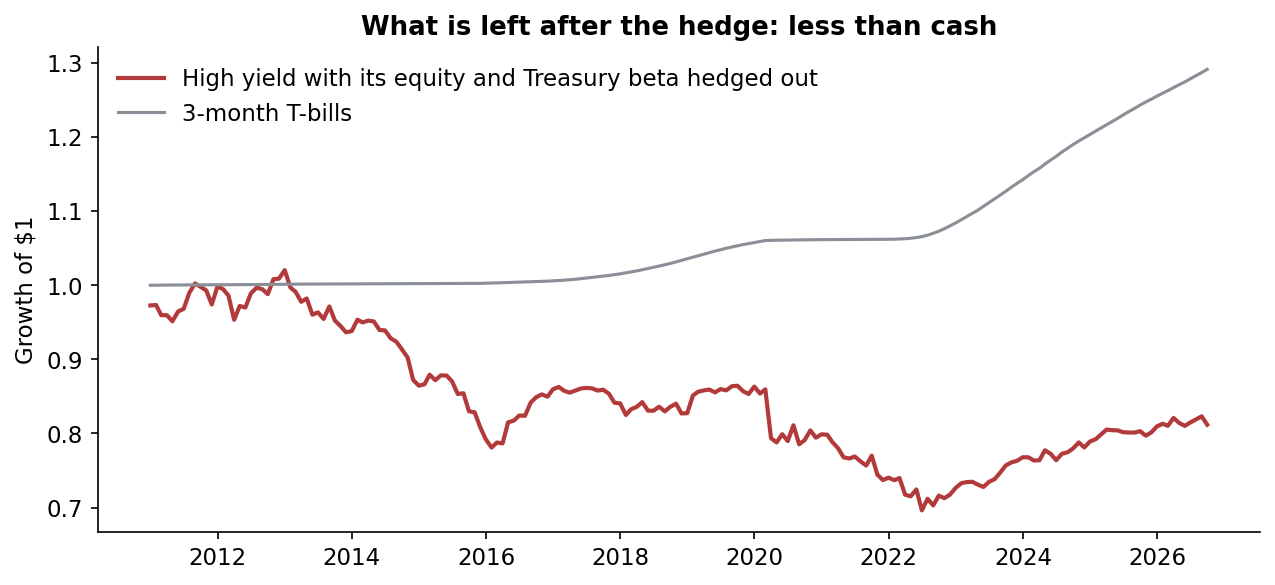
This is the cleanest answer to the question. Take the fund, remove the stock and Treasury exposure it carries, and look at what remains. Over 16 years the residual lost money, and it trailed cash in all three five-year sub-periods.
The result does not say credit risk is never paid. Long-history research on bond indices finds a positive credit risk premium once term risk is removed (Asvanunt and Richardson, 2017). What it says is narrower and more practical. In the largest investable high-yield ETF, over a period that included defaults, fees of about 0.40% a year and ETF trading costs, the premium did not reach the investor.
The commercial case
The deliverable a client would pay for is a credit beta audit. It decomposes every credit holding into equity beta, rate beta and residual. It runs a walk-forward replica, reports the hedged return and up/down betas, and shows how each holding behaved in named stress episodes. Allocators already run equity factor attribution; the same discipline is rarely applied to their credit line-up.
| Element | What it is | Basis |
|---|---|---|
| Who pays | OCIOs and investment consultants; pension, endowment and foundation allocators; insurers' general accounts; wealth platforms choosing credit funds | Budget holders: CIO, head of manager research, head of fixed income |
| The problem in dollars | About $30M a year per $1bn: the gap between JNK and its equity + Treasury replica, 2011–2026 | 3.0 points × $1bn (illustrative; past gap, not a forecast) |
| The product | A monthly credit beta report per holding: factor betas, up/down beta, walk-forward replica, hedged residual and stress episodes | This repository is the working prototype |
| Proof | 226 months of real data, walk-forward, tested, every number reproducible | Public code and data |
| Build vs buy | 4–6 weeks to run it across a client's credit line-up with one quant; it uses fund returns the client already has | Illustrative effort |
| Pricing logic | $25–50k per line-up review, or $100k a year for a standing monitor | Illustrative; small against a 3-point gap on any meaningful allocation |
| What could stop adoption | Private credit funds report smoothed quarterly marks, which hide beta; replica turnover and tax must be shown | Mitigation: unsmooth marks; report net-of-tax replica |
| How a client judges it | Holdings resized or replaced, beta-adjusted fees, stress losses avoided | Reported per holding |
All prices and effort figures are illustrative assumptions with their arithmetic shown. Value figures come from this project's results; they are not a forecast for any firm.
Recommendations
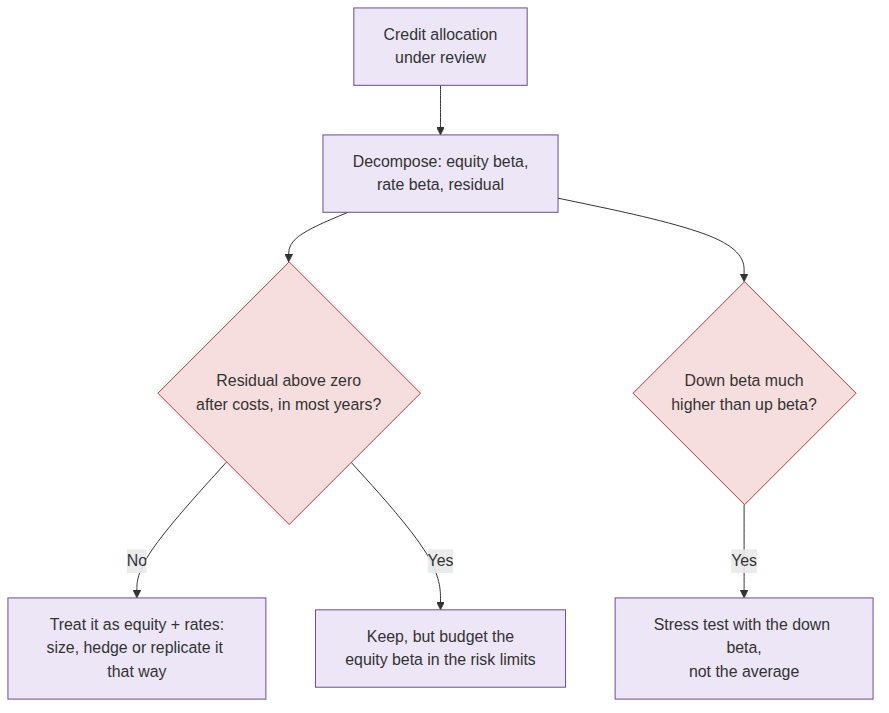
- Count high yield in the equity risk budget. About half of its risk is equity risk, and more in falling markets.
- Stress with the down-market beta. Use roughly 0.7, not the average 0.55, when sizing equity drawdown scenarios.
- Demand a positive residual. Keep a high-yield holding only where its return after equity beta, rate beta and fees has been positive over a full cycle.
- Consider replication for passive exposure. A rules-based mix of stocks, Treasuries and cash matched the exposure with lower volatility in this sample.
- Audit the whole credit line-up. Apply the same test to bank loans, private credit and multi-asset credit funds, unsmoothing quarterly marks where needed.
Limits
- One fund. JNK is the only high-yield ETF with a long history in the source data. Other funds, active managers or the cash bond index may differ.
- Constructed Treasury leg. The 5-year return is built from yields, not traded. A futures or ETF hedge would add small costs.
- A strong decade for stocks. 2011–2026 favoured equities. The negative residual and the hedged result control for that exposure, but a period of weak stocks and good credit would narrow the replica's lead.
- Betas move. The replica uses past betas. In a sudden regime change they lag, as rolling estimates always do.
- Not a trade recommendation. This is independent research on public data. It has not been deployed and is not investment advice.
How it was built
Sources
Data
- JNK and SPY daily prices and dividends: Yahoo Finance, via huggingface.co/datasets/defeatbeta/yahoo-finance-data (ODC-BY).
- US Treasury daily par yield curve: U.S. Department of the Treasury, via the same dataset.
Research
- Asvanunt, A. and Richardson, S. (2017). "The Credit Risk Premium." Journal of Fixed Income 26(3), 6–24. lbsresearch.london.edu/id/eprint/567
- Merton, R. C. (1974). "On the Pricing of Corporate Debt: The Risk Structure of Interest Rates." Journal of Finance 29(2), 449–470.
- Fama, E. F. and French, K. R. (1993). "Common Risk Factors in the Returns on Stocks and Bonds." Journal of Financial Economics 33(1), 3–56.
- Collin-Dufresne, P., Goldstein, R. S. and Martin, J. S. (2001). "The Determinants of Credit Spread Changes." Journal of Finance 56(6), 2177–2207.
- Newey, W. K. and West, K. D. (1987). "A Simple, Positive Semi-Definite, Heteroskedasticity and Autocorrelation Consistent Covariance Matrix." Econometrica 55(3), 703–708.
Independent research on public data, not investment advice; dollar figures are illustrative. Analysis, code, charts and text were produced with AI assistance and reviewed by the author.