Trepp reported the US CMBS delinquency rate at 8.02% in September 2026, the highest since 2020, with office at 12.16% (as reported by Scotsman Guide). This time the stress sits in office and in loans that cannot refinance at today's rates. For a CMBS investor, a CRE lender or a risk committee, the useful question is not which loans are already in trouble. Servicers report those. It is which loans that are paying on time today will be in special servicing a year from now, while there is still time to act.
This note tests that question on the loan-level data issuers file with the SEC every month: 190 conduit trusts, 10,531 loans, 3,280 quarterly remittance tapes from December 2019 to June 2024. The answer is useful, and it comes with a governance lesson that matters more than the model.
Executive summary
The question. Of the conduit CMBS loans that are current today, which will transfer to special servicing, go 60+ days delinquent or fail to pay off at maturity in the next 12 months?
The approach. A point-in-time panel from SEC ABS-EE loan tapes: 109,543 loan-quarter snapshots of performing loans, each labelled with what happened over the following four quarterly tapes. Three challengers against a servicer-style watchlist rule, tested walk-forward: each quarter from mid-2022 to mid-2023 is scored only by models fitted on outcomes already known at that date.
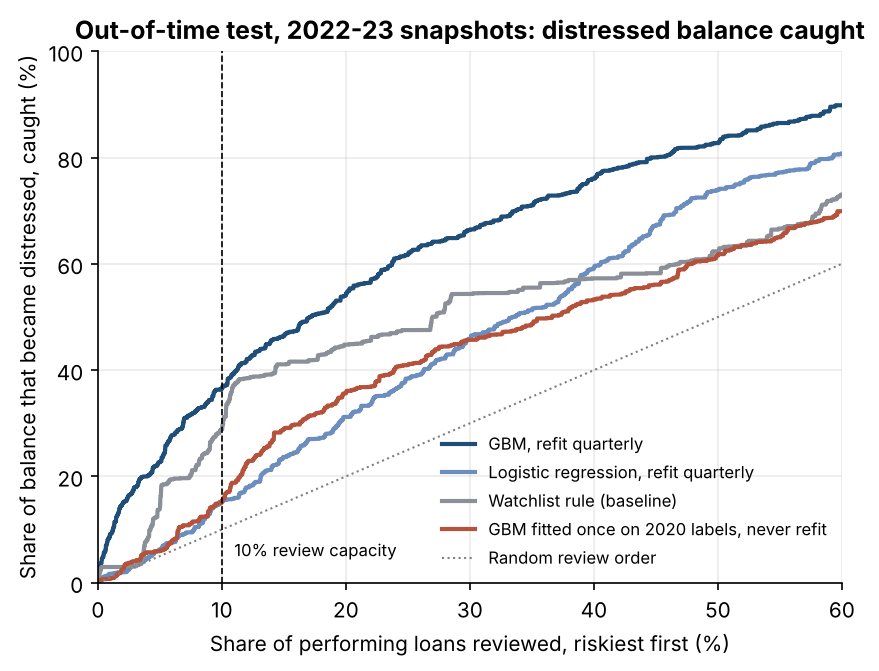
The answer. A gradient-boosted model refit every quarter ranks the book materially better than the watchlist: AUC 0.770 against 0.647, and 36.5% of the distressed balance in the top decile against 28.8%. The same model fitted once on pandemic-era outcomes and left alone scores 0.629 and catches 15.3%, worse than the rule. The stress moved from hotels and retail to office, and a model that is not refit keeps looking for the last crisis.
The decision it supports. Use the score to order the quarterly surveillance queue, keep the watchlist rule as a floor, refit on a fixed cadence with an embargo, and do not use the raw probability to set reserves.
Business outcomes
| Business lever | Watchlist rule today | With a quarterly-refit model | What it means |
|---|---|---|---|
| Review queue (top 10% of loans) | Catches 28.8% of the balance that goes bad | Catches 36.5% | About a quarter more of the problem in front of an analyst with the same headcount |
| Distressed balance reached, per $10bn book | About $79M of the $274M that goes bad in a year | About $100M | $21M more exposure flagged a year ahead |
| Loss avoided (illustrative), per $10bn | About $4.1M | About $5.2M | About $1.1M a year at assumed 35% severity and 15% mitigation |
| Hit rate of the review list | 5.1% of reviewed loans go bad | 7.4% | Fewer wasted deep-dives per real problem |
| Model risk | Static thresholds; blind to sector rotation | Refit with embargo and a rule floor | A fixed governance process instead of a one-off model |
| Refinancing exposure | Flags maturity within 12 months | Ranks maturity with cash flow and coupon | The wall is priced loan by loan, not just dated |
Test window 2022Q2-2023Q2: 38,765 performing loan-quarters, about $136bn of performing balance per quarter, 2.74% of balance entering distress within 12 months. Per $10bn: 2.74% x $10bn = $274M; caught = $274M x capture share at 10% review capacity. Loss avoided = caught x 35% assumed loss severity x 15% assumed share of loss avoided by acting a year earlier. Severity and mitigation are illustrative assumptions, not estimates.
End to end in six steps
| Step | What happens | Output |
|---|---|---|
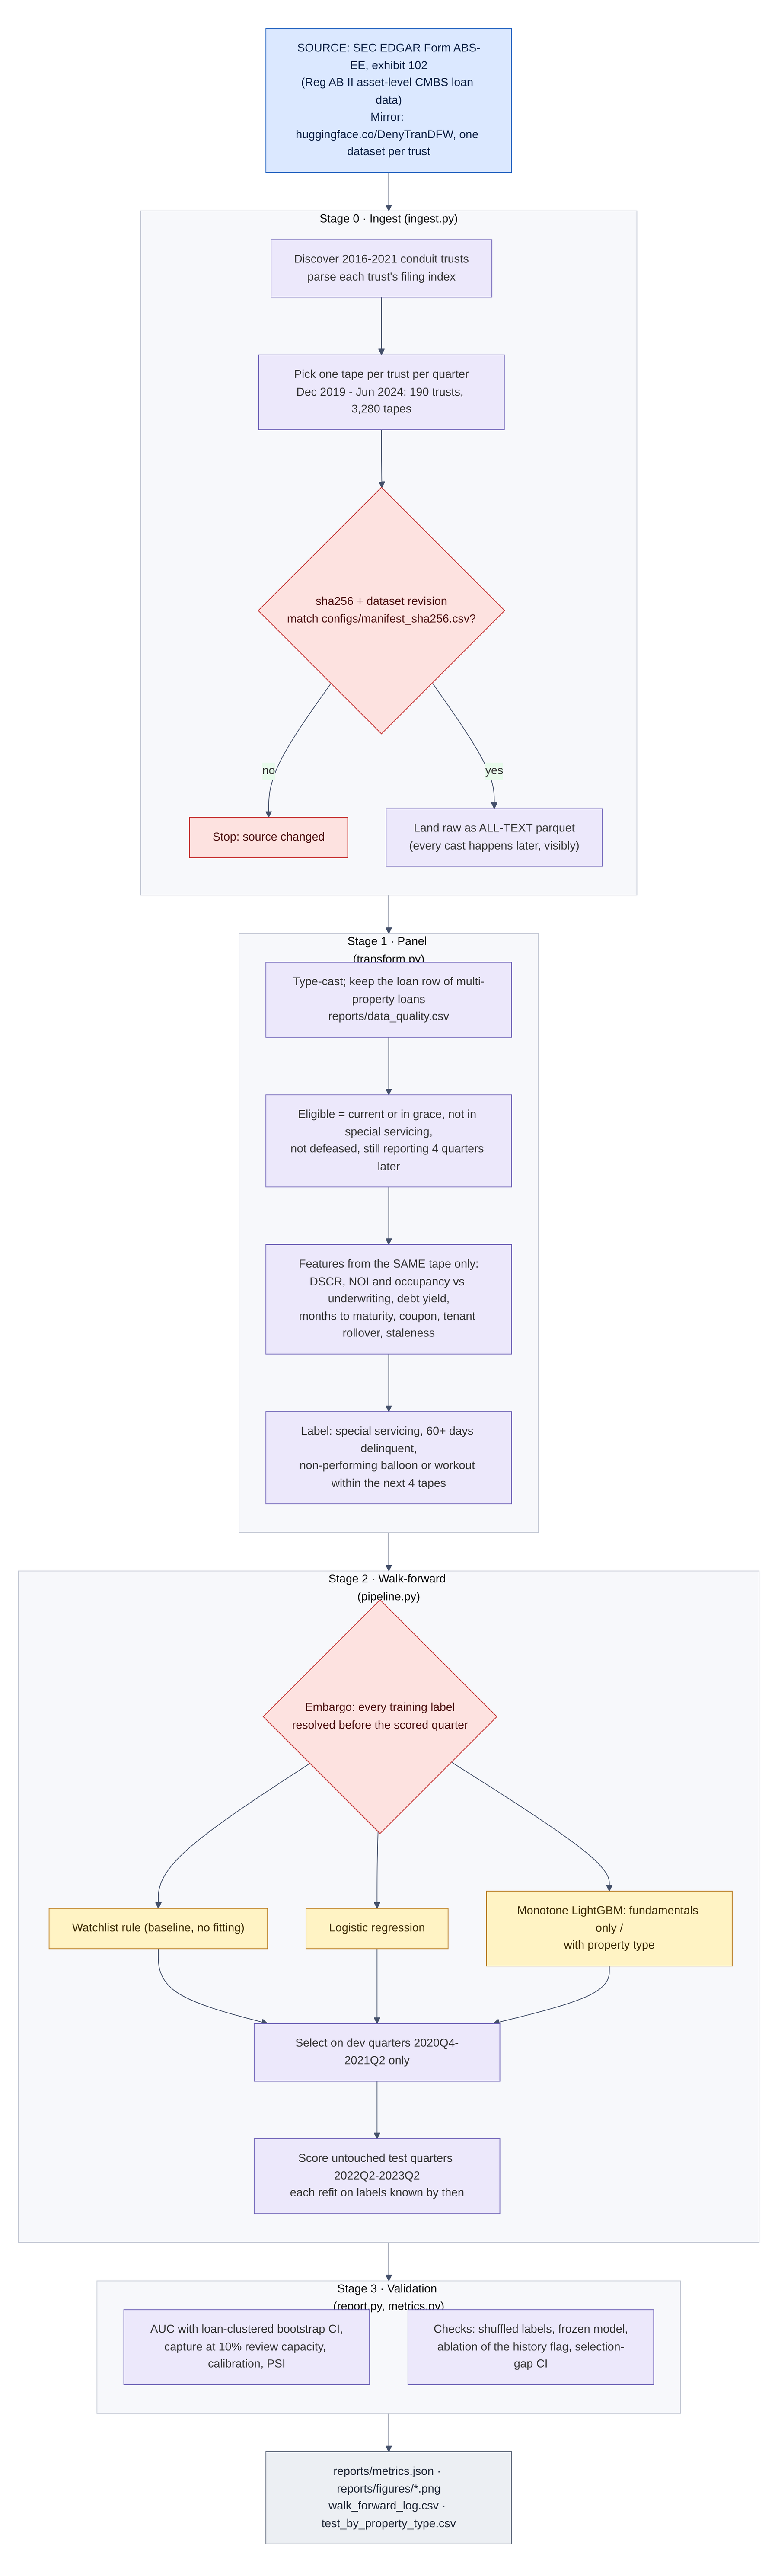
| 1. Source | Discover 190 conduit trusts (2016-2021 issuance) in the SEC ABS-EE mirror; pick one tape per trust per quarter; verify sha256 and dataset revision | 3,280 pinned tapes |
| 2. Clean | Land raw as text; type-cast visibly; keep the loan row of multi-property loans | 167,115 loan-quarter rows, data-quality report |
| 3. Select and label | Keep performing loans (current, not in special servicing, not defeased); label distress over the next four tapes | 109,543 snapshots, 2,376 events |
| 4. Features | Cash flow and occupancy versus underwriting, debt yield, maturity, coupon, tenant rollover, reporting staleness, history | 27 point-in-time features |
| 5. Walk-forward test | Every quarter scored by models fitted only on outcomes already resolved; selection on 2020Q4-2021Q2; test 2022Q2-2023Q2 | Scores for 38,765 test snapshots |
| 6. Decide | Rank the book; review the top 10%; compare capture, calibration and stability against the rule | Review queue, monitoring metrics |
The data, and why it is the right test
Every public CMBS deal files a loan-level exhibit with the SEC each month under Regulation AB II: balance, coupon, maturity, payment status, special-servicing dates, and the property's reported cash flow, occupancy and largest tenants. It is the same information a surveillance desk sees, at the same time it sees it. That makes it possible to replay the decision honestly: what was knowable on each remittance date, and what happened next.
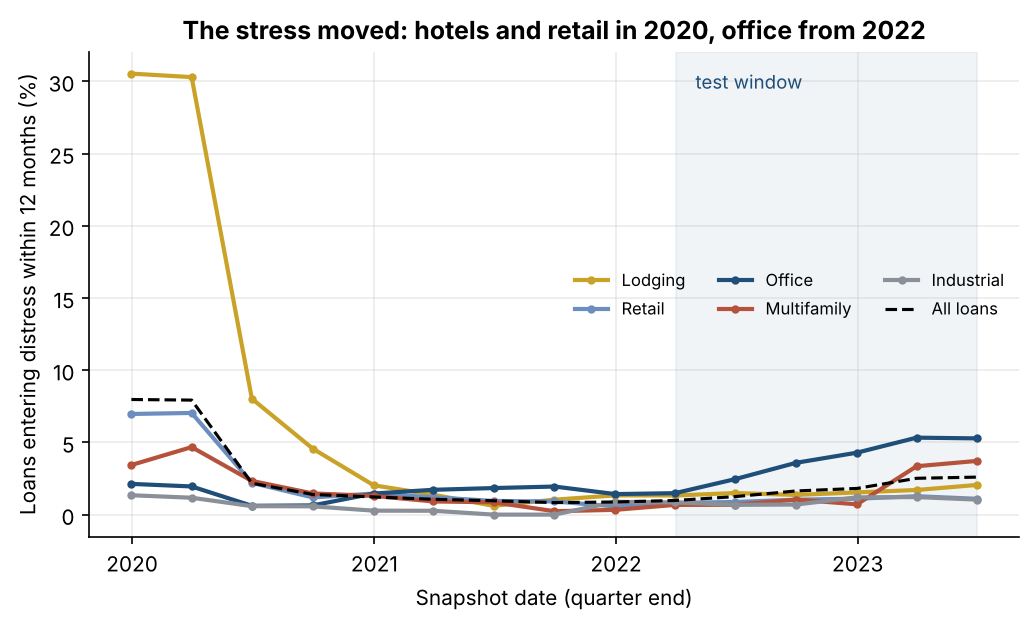
The window covers two different stresses. In 2020 the shock hit hotels and retail almost overnight: 30% of performing lodging loans from the December 2019 snapshot entered distress within a year. From 2022 the stress moved to office and to loans facing refinancing at much higher rates. Testing on 2022-23 snapshots asks whether a model learns the mechanics of distress or just the sector of the last crisis.
Feature engineering: what the model sees
| Feature | How it is built | Why it matters |
|---|---|---|
| DSCR and DSCR vs underwriting | Latest reported net-cash-flow coverage, and its ratio to coverage at issue | Coverage erosion is the classic early sign |
| NOI vs underwriting, debt yield | Latest NOI over NOI at issue; latest NOI over current balance | Rate-free measure of how refinanceable the loan is |
| Occupancy and change | Latest physical occupancy; change since issue | Leasing trouble shows here before it shows in cash flow |
| Months to maturity | From the tape date to the scheduled maturity | The refinancing wall: balloon risk at higher rates |
| Coupon and loan age | Rate set at issue; months since origination | The market's own risk price, and seasoning |
| Largest tenant | Share of space and months left on its lease | Concentration and rollover risk |
| Financials staleness | Months since the latest reported financial period; missing flag | Late or missing reporting is information |
| Prior distress | Any distress or special-servicing transfer on this loan's earlier tapes | Cured loans re-default; computed from past tapes only |
| Property type | Office, retail, lodging, multifamily, industrial, mixed use, self storage, other | Sector exposure, tested with and without |
Every feature comes from the same remittance tape as the snapshot. Payment status, advances and workout fields are used only to define eligibility and the label, never as inputs.
Method
Four contenders, all scored the same way.
- Watchlist rule (baseline). Count of servicer-style triggers: DSCR below 1.10x, occupancy below 80%, NOI more than 25% below underwriting, maturity within 12 months, a large tenant with a lease expiring inside a year. No fitting.
- Logistic regression on all features.
- Gradient-boosted trees with monotone constraints where the economics are unambiguous (lower coverage, lower debt yield and lower occupancy can only raise risk), in two versions: fundamentals only, and with property type.
The test is walk-forward. Each quarter from 2022Q2 to 2023Q2 is scored by models fitted only on snapshots at least four quarters older, so every training label had resolved by the scoring date. The code asserts this embargo. Model settings were chosen on 2020Q4-2021Q2 only; the test quarters were scored once.
Results
| Model (test 2022Q2-2023Q2) | AUC | Top-10% catches: events | Top-10% catches: distressed balance |
|---|---|---|---|
| Watchlist rule | 0.647 | 26.1% | 28.8% |
| Logistic regression (selected on dev window) | 0.653 | 18.8% | 15.2% |
| GBM, fundamentals only | 0.762 | 37.9% | 38.4% |
| GBM, with property type | 0.770 | 38.1% | 36.5% |
| GBM fitted once on 2020 outcomes, never refit | 0.629 | 18.1% | 15.3% |
AUC 95% intervals from a loan-clustered bootstrap: GBM with property type 0.744-0.793; watchlist rule 0.618-0.678. 755 distress events among 38,765 test snapshots (1.95%).
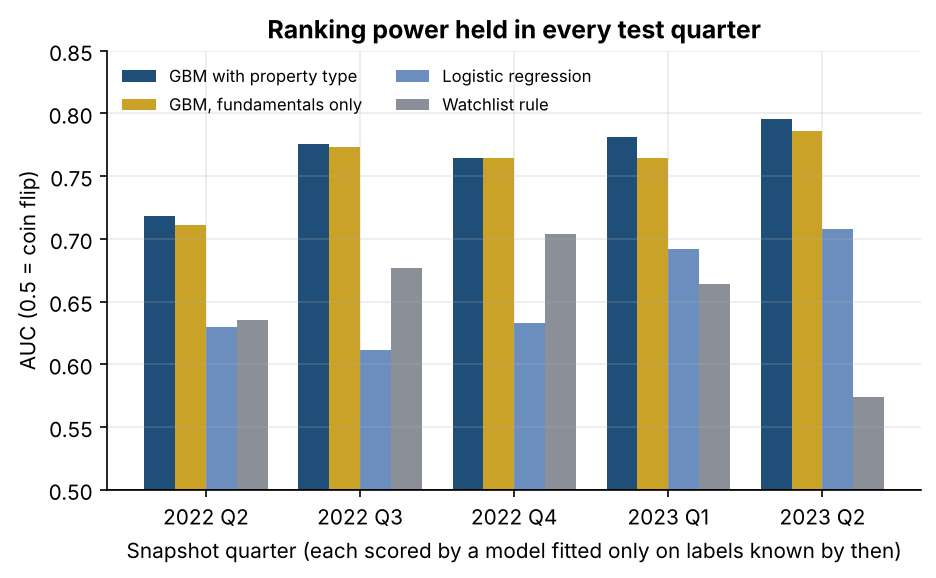
The ranking held in every test quarter, from 0.718 in 2022Q2 to 0.796 in 2023Q2, while the watchlist rule fell to 0.574 by mid-2023.
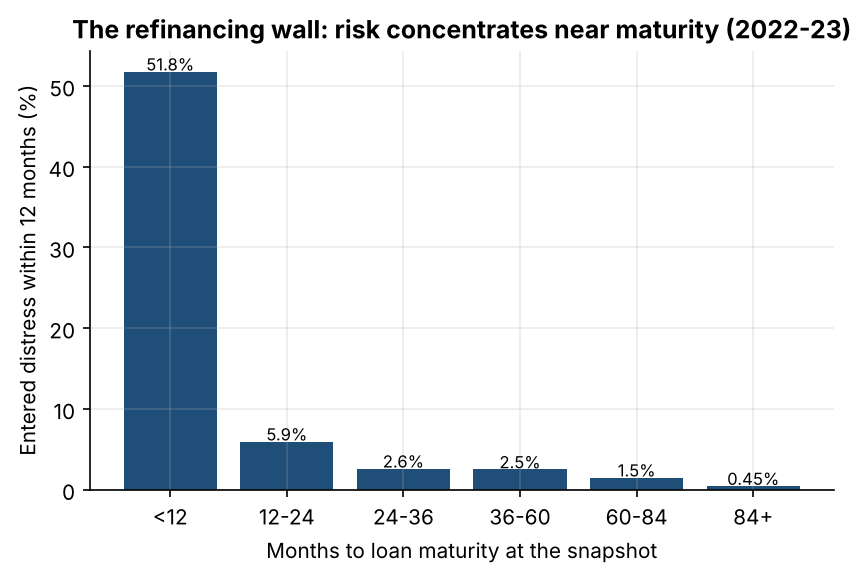
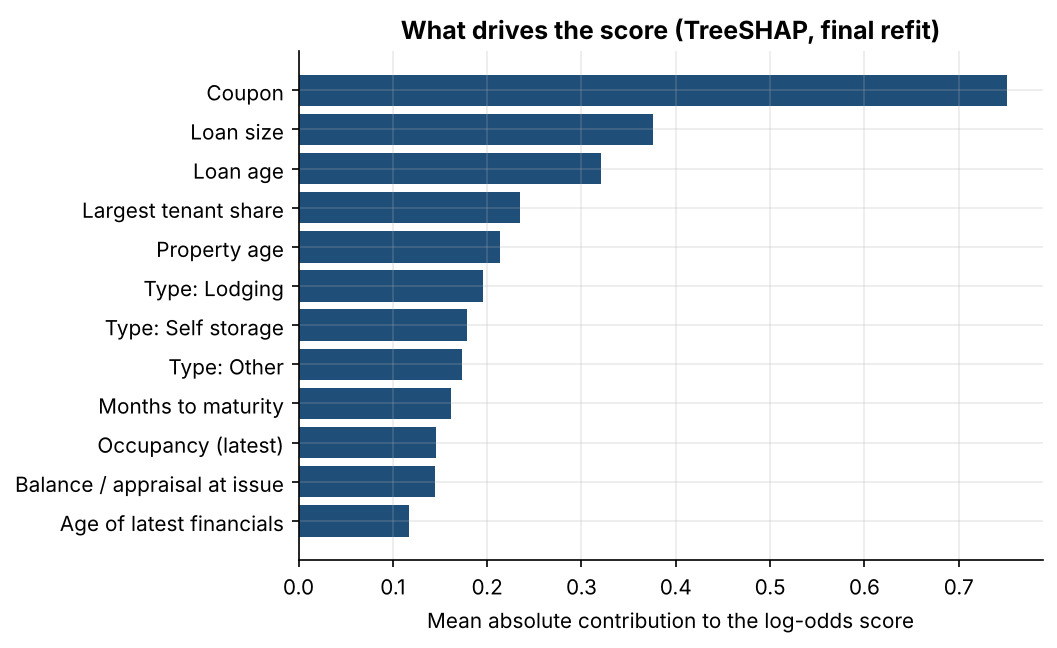
The refinancing wall is the clearest single signal. Performing loans within 12 months of maturity entered distress at 51.8% over the following year. Loans more than seven years from maturity: 0.45%. Coupon set at issue was the strongest driver of the score: distress rose from 0.8% in the lowest coupon quintile to 3.4% in the highest.
The selection window could not pick the winner. On the pre-test quarters, logistic regression edged the boosted model (AUC 0.648 against 0.634), and that is what a pre-registered process would have selected. The bootstrap interval on the gap runs from -0.031 to +0.064: a statistical tie on a thin, low-default window. On the test, the logistic model caught 15.2% of distressed balance against 36.5%. I report it as it happened. The governance response is to run champion and challenger in parallel and promote on resolved evidence, not to choose once on a calm window.
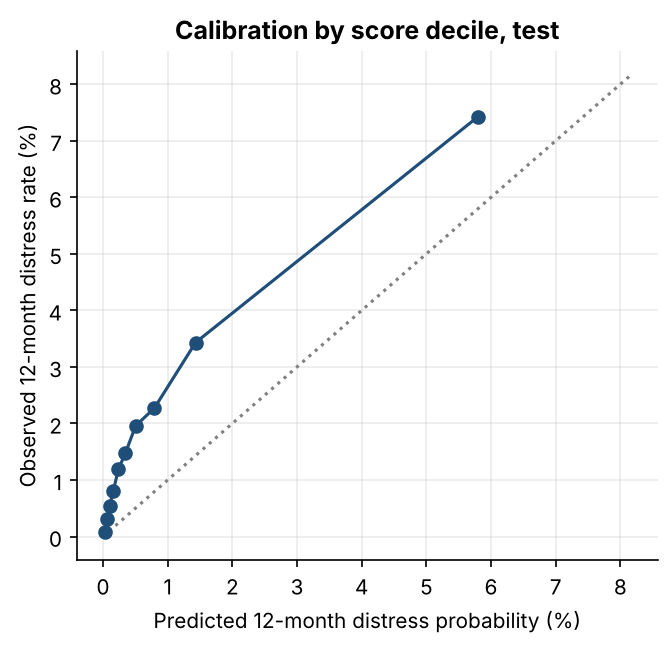
Ranking held; level did not. Mean predicted probability on the test was 0.95% against 1.95% observed, and score PSI from the selection window to the test was 0.92. The score orders a queue well; it does not set reserves without a scenario overlay.
Checks. Removing the loan's own distress history barely moves the result (AUC 0.765), so it is not driven by repeat offenders. The same model fitted on shuffled labels averages 0.47 AUC over five permutations: no better than chance, so nothing is leaking. Twenty-eight percent of loan rows carry no current DSCR, which is why staleness and missing flags are features rather than rows to drop.
Recommendations
- Decision. Order the quarterly surveillance queue by the refit score; keep every watchlist trigger as a hard floor so nothing the rule would catch is dropped.
- Cadence is the control. Refit quarterly on resolved outcomes only, with a one-year embargo enforced in code. A model frozen on one cycle's outcomes is worse than the rule in the next.
- Champion and challenger in parallel. Run the logistic and boosted models side by side and promote on two resolved quarters of evidence; fall back to the rule automatically if neither beats it.
- Separate ranking from level. Use the score for ordering; set reserves and capital with a stressed scenario, not the raw probability.
- Put the maturity wall first. Every loan inside 24 months of maturity gets a refinance-path review regardless of score.
- Monitor. Quarterly: capture versus the rule, AUC by property type, score PSI (alert above 0.25), calibration by decile, and the missing-financials rate by servicer.
Limits
- Conduit CMBS only: no single-asset deals, CRE CLOs or bank balance-sheet loans.
- Quarterly sampling can miss a 60-day delinquency that cures within a quarter; special-servicing transfers are captured by date.
- Mirror coverage thins after mid-2024, so the latest test snapshot is 2023Q2 and its outcomes run to mid-2024.
- Weak segments: lodging and industrial (AUC about 0.60) with few events in the test window.
- Loss severity and mitigation in the business table are assumptions. This is independent research on public data, not a deployed model and not investment advice.

Sources
Data
- U.S. Securities and Exchange Commission, EDGAR Form ABS-EE asset-level filings (Regulation AB II), exhibit 102, for 190 CMBS conduit trusts issued 2016–2021: sec.gov/edgar. Copy used: per-trust parquet mirrors published by huggingface.co/DenyTranDFW (GPL per dataset card; each card links every filing to sec.gov), pinned by dataset revision and sha256.
- SEC, Asset-Backed Securities Disclosure and Registration, Release No. 33-9638 (2014): sec.gov/rules/final/2014/33-9638.pdf
Market context
- Kingsley, R. (2026, October 6). "CMBS delinquencies reach highest level since 2020." Scotsman Guide, citing Trepp: scotsmanguide.com
Methods referenced
- Ke, G. et al. (2017). "LightGBM: A Highly Efficient Gradient Boosting Decision Tree." Advances in Neural Information Processing Systems 30.
- Lundberg, S. M. et al. (2020). "From local explanations to global understanding with explainable AI for trees." Nature Machine Intelligence, 2, 56–67. doi:10.1038/s42256-019-0138-9
- Hanley, J. A. and McNeil, B. J. (1982). "The meaning and use of the area under a receiver operating characteristic (ROC) curve." Radiology, 143(1), 29–36. doi:10.1148/radiology.143.1.7063747
- Efron, B. and Tibshirani, R. J. (1993). An Introduction to the Bootstrap. Chapman and Hall.