WTI crude has nearly doubled this year, up 92% to 19 October. Natural gas has swung hard in both directions, and commodities are back in investment committee discussions as an inflation hedge and a diversifier for a 60/40 portfolio that lost both legs in 2022. The question that gets the least attention is how the exposure is held. Almost no investor owns the barrel. They own futures contracts, or a fund that holds them, and futures expire. Every month or so the position has to be sold and bought again further out on the curve, at whatever price the curve offers.
That roll is not a technicality. Over the last nineteen years it decided whether a commodity allocation made money or lost most of it. I tested what each common way of holding oil, natural gas and broad commodity futures actually delivered against the spot price it was meant to track.
Executive summary
The question. When a portfolio takes commodity exposure through futures, how much of the spot price move does it keep? Which way of holding the contracts should an investment committee approve, and can the roll be timed?
The approach. I compared funds with different roll designs against the spot price of what they hold, using U.S. Energy Information Administration spot prices for WTI crude and Henry Hub gas, and 3-month Treasury bill income for the collateral every futures fund holds.
- Oil (226 months from January 2008):
- USO holds the front-month contract.
- USL spreads across the next 12 contracts.
- DBO picks the contract with the best expected roll.
- Natural gas (from February 2010): UNG holds the front month; UNL holds the 12-month strip.
- Broad commodity funds (from September 2010): three index designs, GSG, DBC and USCI.
All returns include distributions. A rule that switches between front month and strip on recent roll experience was specified in advance and tested at three lookbacks.
The answer. The front month cost oil investors 8.8% a year against spot plus T-bill income, and natural gas investors 23.7%. Spreading the position across the curve cut the oil cost to 1.4% a year. When the curve slopes down, as it has in 2026, the front month earns rather than pays: USO is up 132.5% this year against 92.1% for spot. But switching on recent roll experience did not capture this; every version of the rule trailed simply holding the strip. Among broad funds, the design that tilts toward backwardated commodities returned 5.1% a year, against 1.8% for the front-weighted index.
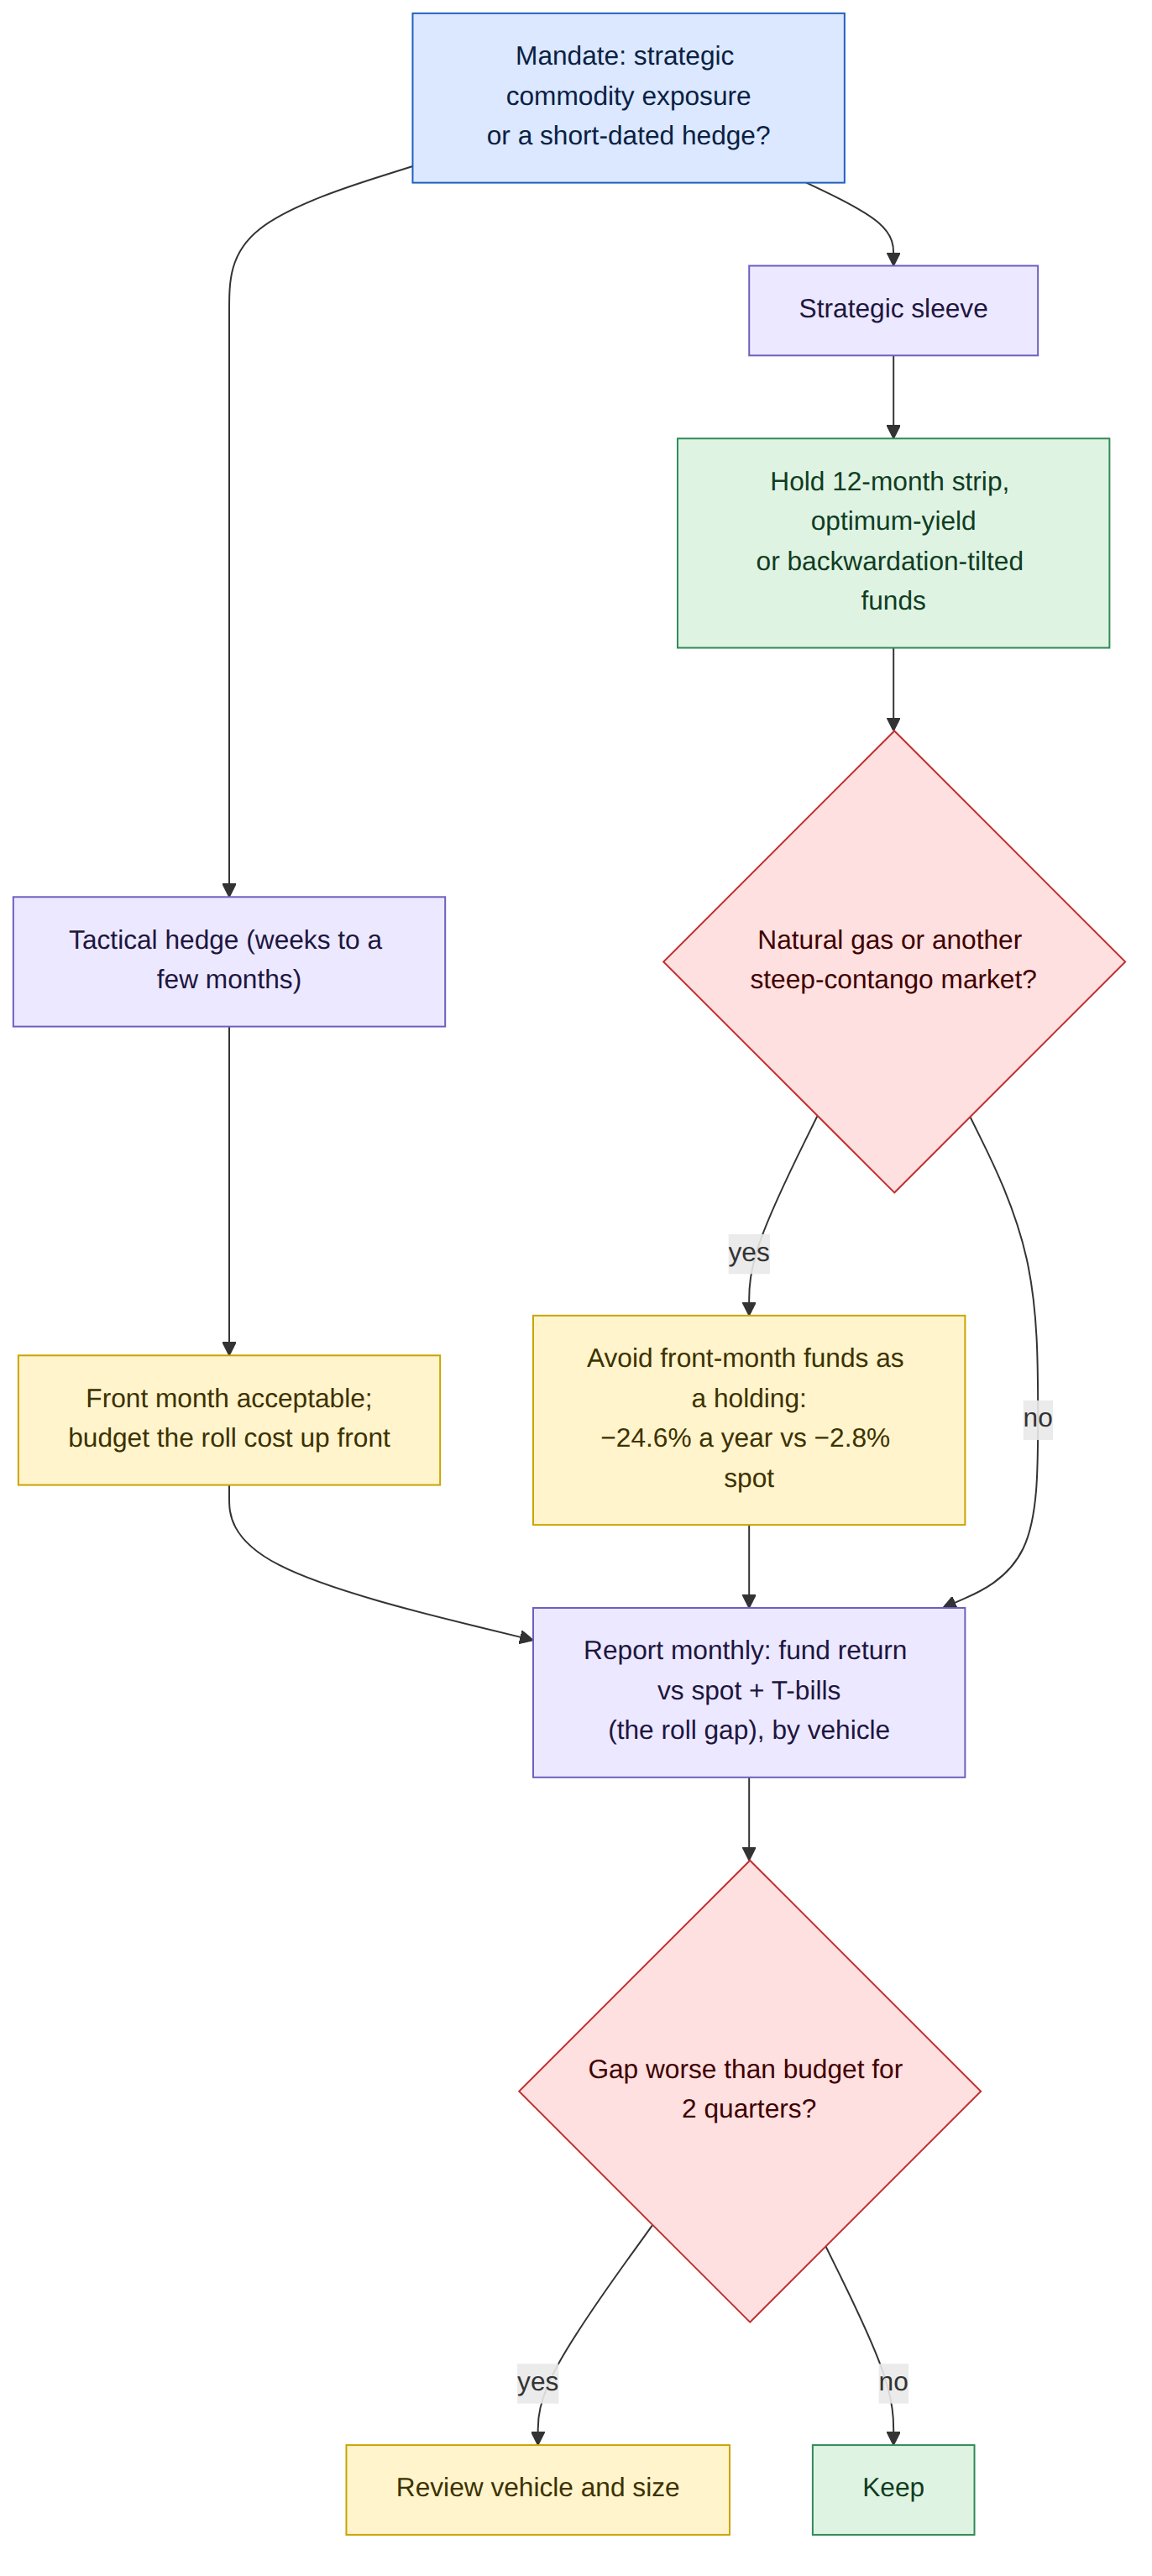
The decision it supports. Hold strategic commodity exposure through strip, optimum-yield or backwardation-tilted vehicles. Use the front month only for short, defined hedges with the roll cost budgeted. Never hold front-month natural gas as a position. Report the roll gap every month, as you would report tracking error.
Business outcomes
| Business lever | Front month | Spread across the curve | What it means |
|---|---|---|---|
| $100M in oil, Jan 2008 to Oct 2026 | $26.5M (USO) | $116.2M (USL); $88.0M optimum yield (DBO) | Same commodity view, $90M apart |
| Annual gap to spot + T-bill income, oil | −8.8% | −1.4% (USL); −2.8% (DBO) | The cost of the vehicle, every year |
| Gap in 2008–2016 vs 2017–2026, oil | −13.5% vs −4.3% | −4.5% vs +1.6% (USL) | The ranking held in both halves |
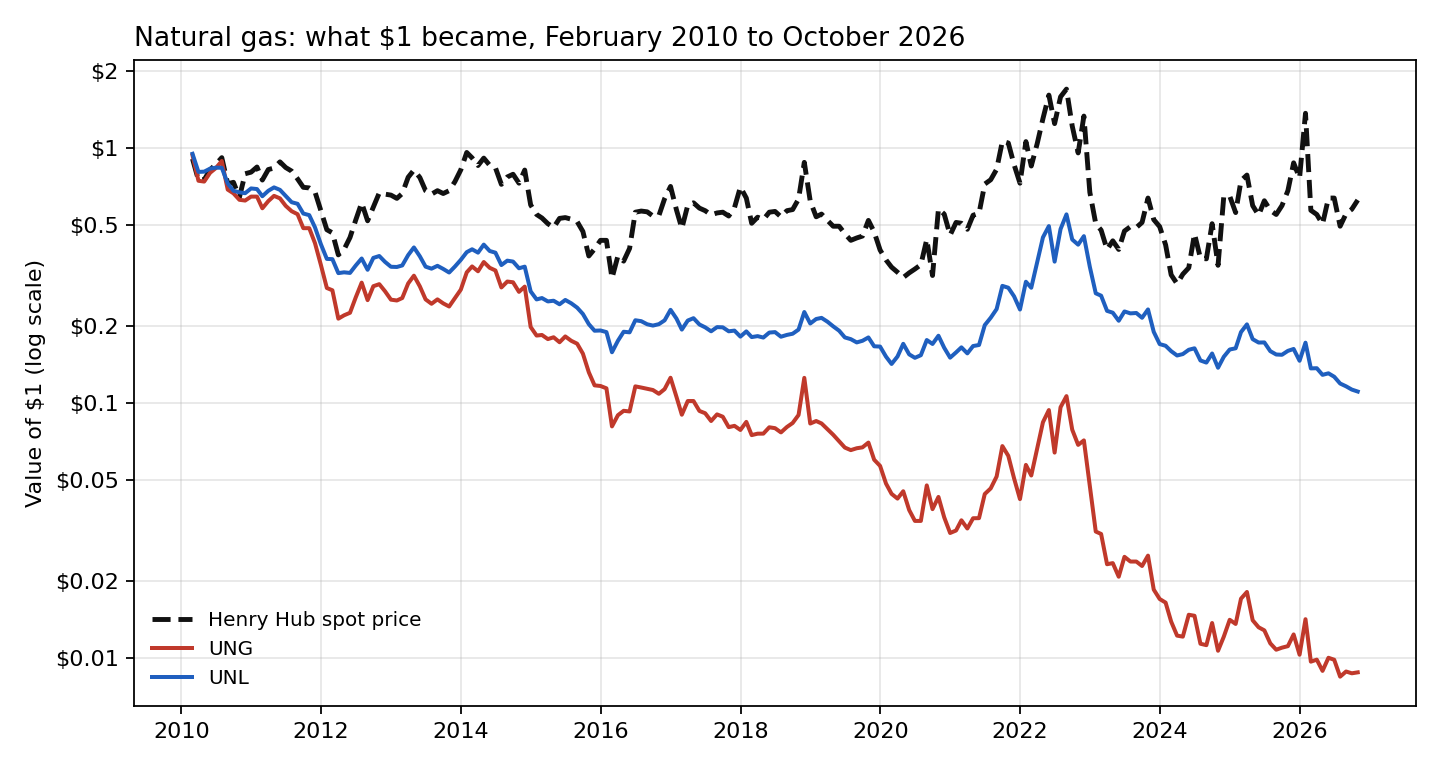
| $100M in natural gas, Feb 2010 to Oct 2026 | $0.9M (UNG) | $11.1M (UNL) | Henry Hub itself fell to $62.4M of value |
| Worst drawdown, oil | −97.9% | −87.3% (USL) | Neither is a low-risk asset |
| Sensitivity to the spot price (beta, monthly) | 0.85 | 0.65 | The strip needs about 1.3 times the notional to hedge the same spot move |
| 2026 to date, oil in backwardation | +132.5% | +88.5% (USL); spot +92.1% | The front month pays when the curve slopes down |
| Switching on recent roll experience | n/a | −1.7% to −4.3% a year vs +0.8% holding the strip | Timing the curve shape did not work |
Fund total returns include distributions and management fees. Gap = fund return minus spot price change minus 3-month T-bill income, in log terms, annualised. Spot prices are EIA WTI Cushing and Henry Hub; nobody can hold spot without storage, so it is a reference, not an alternative. Dollar figures apply measured returns to an illustrative $100M allocation.
End to end in five steps
| Step | What happens | Output |
|---|---|---|
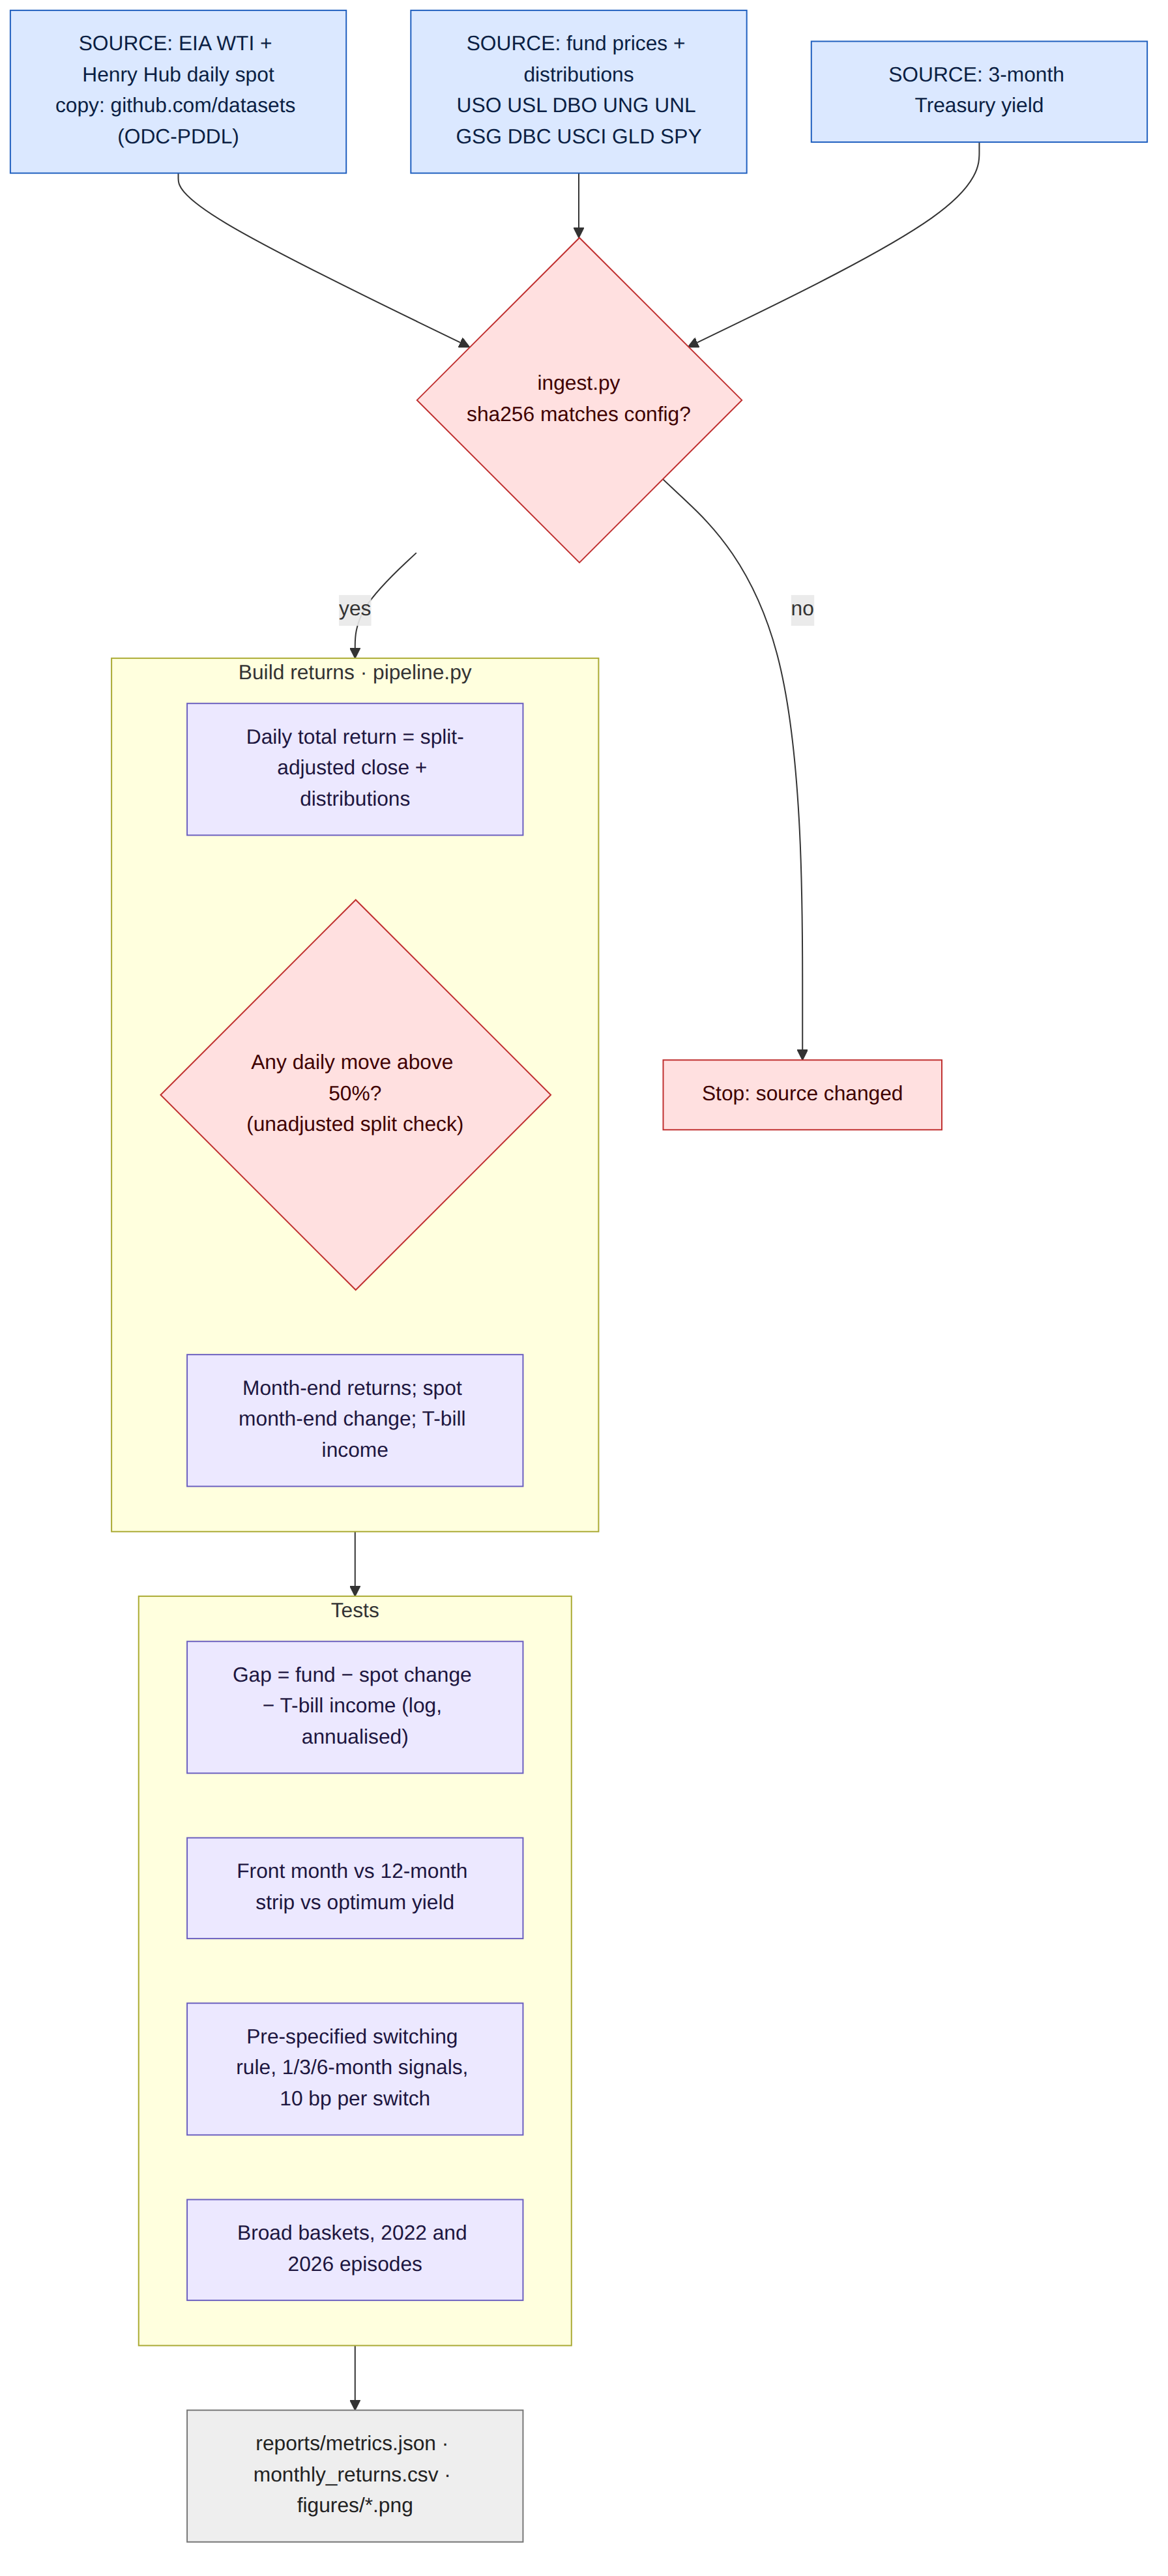
| 1. Source | EIA daily spot prices for WTI and Henry Hub; daily fund prices and distributions; 3-month T-bill yields; every file checksum-pinned | Raw data with provenance |
| 2. Returns | Split-adjusted closes plus each cash distribution on its ex-date, compounded to month-ends; a check stops the run on any daily move above 50% | Monthly total returns |
| 3. Gap | Fund return minus spot change minus T-bill income, in log terms, annualised, by vehicle and by year | The cost or benefit of each roll design |
| 4. Rule test | Hold the front month only after a positive trailing roll (1, 3 or 6 months), otherwise the strip; 10 bp per switch | Can the curve be timed? |
| 5. Decide | Dollar outcomes, drawdowns, hedge sensitivity, 2022 and 2026 episodes | Vehicle policy and monitoring |
The data
The spot prices are the U.S. Energy Information Administration's daily series for WTI crude at Cushing and natural gas at Henry Hub, in public-domain copies. The funds are the most widely held US exchange-traded vehicles for each design:
- USO and UNG hold the nearby contract.
- USL and UNL hold equal amounts of the next twelve contracts.
- DBO and DBC choose, for each commodity, the contract within about a year whose curve shape gives the best implied roll ("optimum yield").
- GSG tracks the S&P GSCI, which is production-weighted, energy-heavy and held in near contracts.
- USCI follows an index that selects commodities partly on the steepness of their backwardation.
Fund prices, distributions and Treasury yields come from Yahoo Finance in a public mirror, and every file is pinned by checksum. The oil comparison starts in January 2008, the first full month with all three oil funds; gas starts in February 2010 and the broad baskets in September 2010.
The roll, in plain terms
| Term | Meaning | Why it matters |
|---|---|---|
| Front month | The futures contract closest to expiry | Tracks today's price most closely, and must be rolled every month |
| Contango | Later contracts cost more than nearer ones (the curve slopes up) | Each roll sells cheap and buys dear: a steady drag |
| Backwardation | Later contracts cost less than nearer ones (the curve slopes down) | Each roll sells dear and buys cheap: a steady gain |
| 12-month strip | Equal amounts of the next twelve contracts | Rolls a twelfth of the position at a time, at the long end of the curve, where the slope is usually gentler |
| Collateral income | Interest on the T-bills a futures fund holds against its contracts | Part of the return; the gap measure removes it |
What it delivered
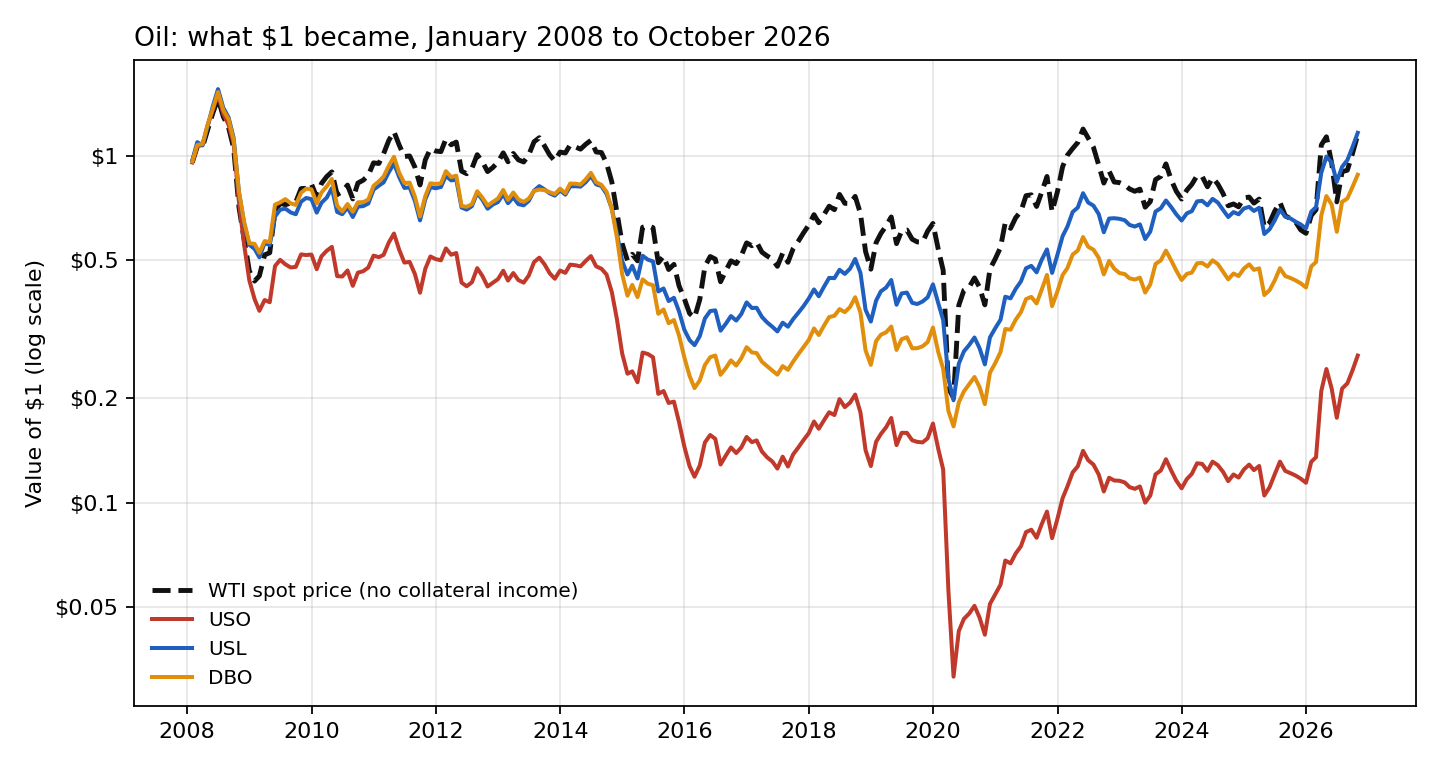
Across the full period, the front-month fund trailed spot plus T-bill income by 8.8% a year. The 12-month strip trailed by 1.4% and the optimum-yield fund by 2.8%. The ranking was the same in both halves of the period: from 2008 to 2016 the gaps were −13.5% and −4.5%, and from 2017 to 2026 they were −4.3% and +1.6%.
The worst single year shows the mechanism. In 2020, when storage filled and the May contract briefly traded below zero, WTI spot fell 20.9% for the year. The front-month fund fell 67.8%, and the strip fell 25.2%. The front month was not wrong about oil. It was forced to roll into a curve in extreme contango.
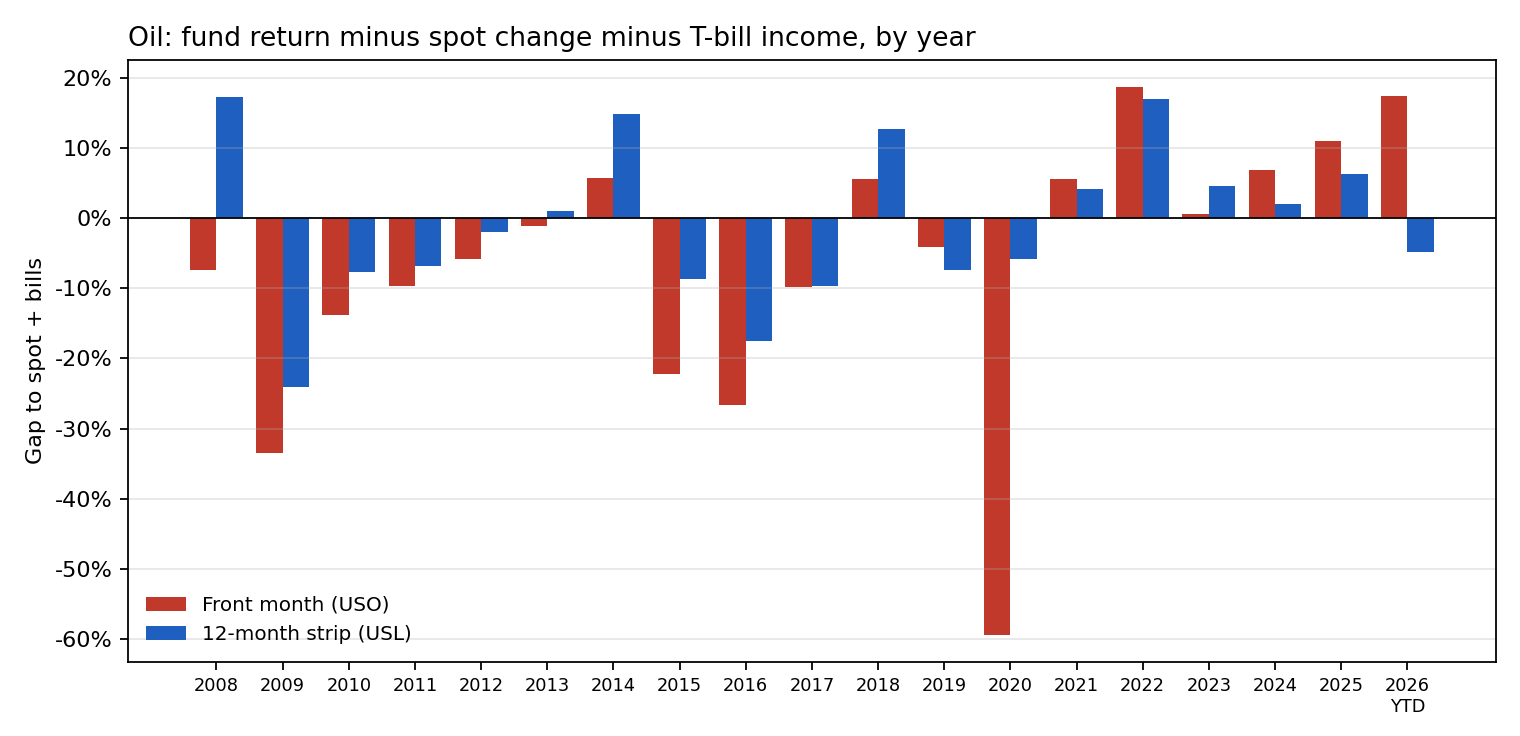
The curve can also pay. In 2021 and 2022, and again in 2026, oil was backwardated and the front month earned more than spot. This year, with WTI up 92.1%, the front-month fund is up 132.5% and the strip 88.5%. That is the case for front-month exposure: it gives the most sensitivity to a price spike and collects roll in backwardation. Its monthly beta to spot was 0.85, against 0.65 for the strip, so a hedger needs about 1.3 times the notional in the strip to cover the same move.
Natural gas shows how steep contango can destroy an exposure. Henry Hub's price fell 2.8% a year from February 2010; the front-month fund fell 24.6% a year, and $100M became $0.9M. The 12-month strip lost 12.3% a year. Gas has a strong seasonal curve, and a front-month holder pays for winter in every contract it rolls.
Can the roll be timed?
If the front month wins in backwardation and loses in contango, the obvious idea is to hold it only when the curve is backwardated. I tested the simplest version that uses only information available at the time. At each month-end, hold the front-month fund next month if its realised roll over the previous one, three or six months was positive; otherwise hold the strip. Each switch costs 10 basis points. The rule and all three lookbacks were fixed before results were examined.
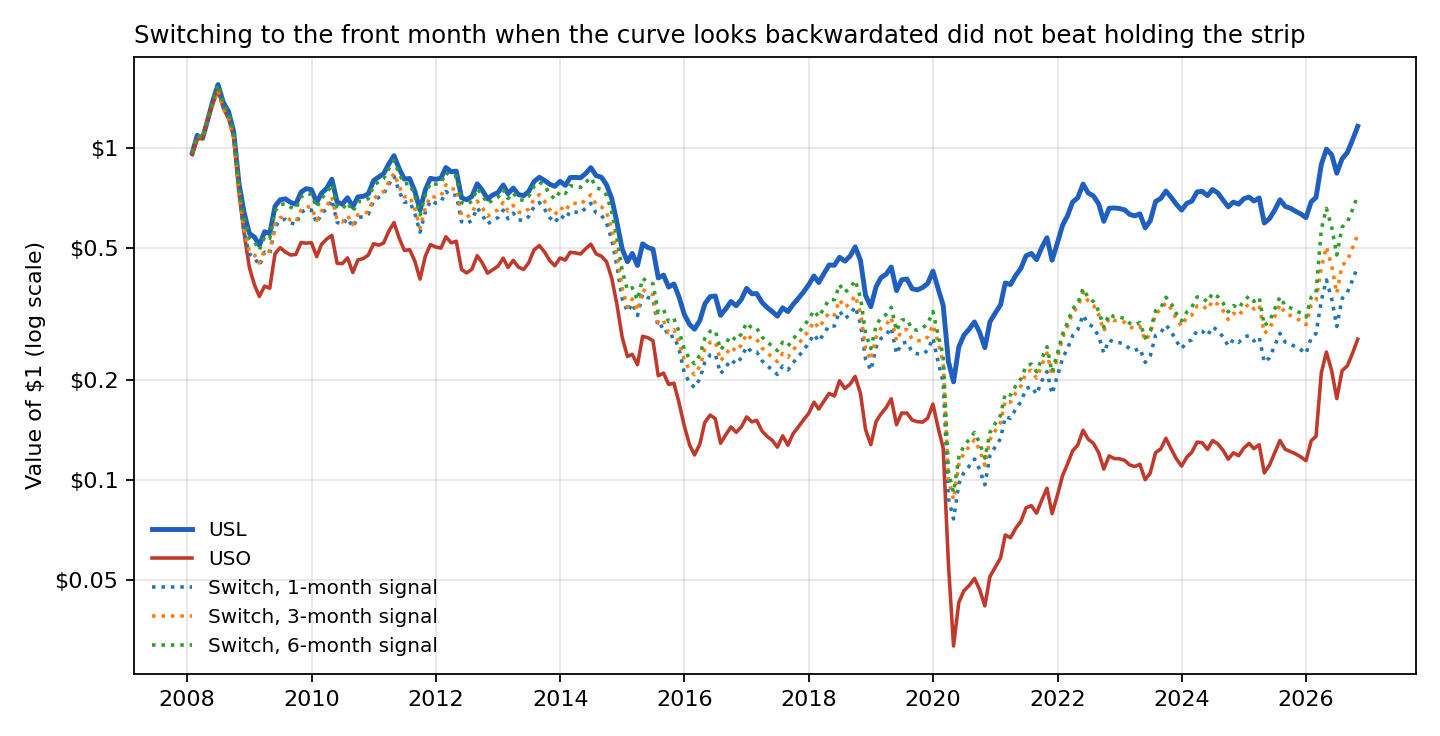
It did not work. The rules returned −4.3%, −3.1% and −1.7% a year, against +0.8% for holding the strip throughout. After a positive three-month roll, the front month still trailed the strip the following month by 0.49% on average. The curve shape is persistent enough to show up in annual averages, but the switches arrive late, at turning points, exactly when the roll changes sign.
Broad commodity funds
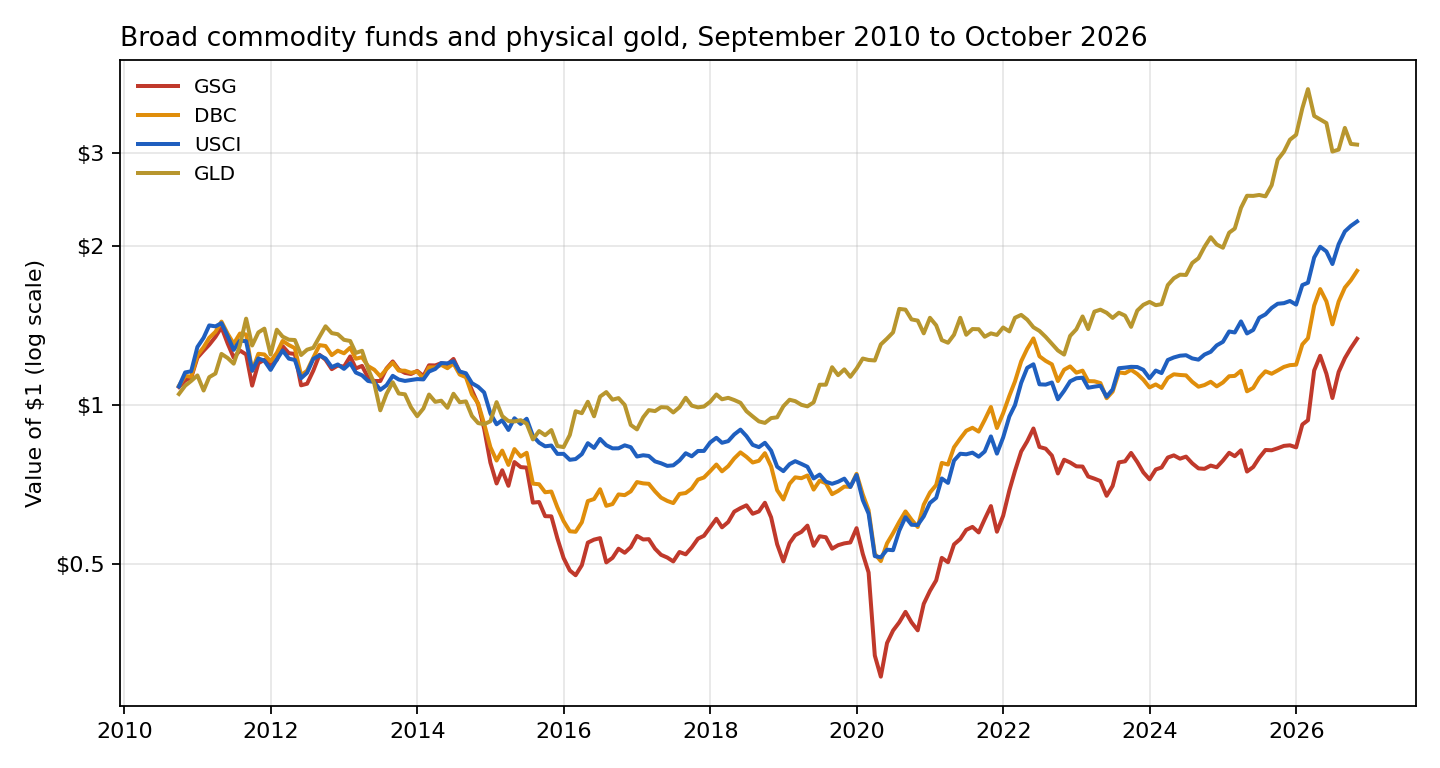
| Sep 2010 – Oct 2026 | Design | Return a year | Volatility | Worst drawdown | 2022 | 2026 to date |
|---|---|---|---|---|---|---|
| GSG | S&P GSCI, near contracts, energy-heavy | 1.8% | 21.4% | −78.2% | +24.1% | +60.6% |
| DBC | Optimum yield, 14 commodities | 3.7% | 17.3% | −64.8% | +19.3% | +50.6% |
| USCI | Backwardation-tilted selection | 5.1% | 14.8% | −64.0% | +29.5% | +43.7% |
| GLD (reference) | Physical gold, no roll | 7.3% | 16.7% | −42.9% | −0.8% | −4.2% |
Total returns including distributions. Correlation of monthly returns with US equities (SPY) was 0.37 to 0.40 for the three commodity funds and 0.12 for gold.
The design ranking matches the single-commodity result: the more a fund avoids the steep front of contango curves, the more of the commodity return it keeps. In 2022 all three broad funds rose between 19% and 30% while the S&P 500 fell 18%. That is the diversification case, and it held when it was needed. Over sixteen years, though, the broad funds earned between 1.8% and 5.1% a year with drawdowns of 64% to 78%. Commodity exposure is a hedge to be owned efficiently, not a source of steady return.
Recommendations
- Approve strategic commodity exposure only through strip, optimum-yield or backwardation-tilted vehicles. In oil the strip kept about 7 points a year more than the front month; in broad baskets the backwardation-tilted design kept about 3 points more than the front-weighted index.
- Use front-month instruments only as defined, short hedges. They give the most sensitivity to a price spike and collect roll in backwardation. State the expected roll cost before the trade, and set a maximum holding period.
- Do not hold front-month natural gas as a position. It lost 24.6% a year against 2.8% for the price.
- Size hedges by beta, not notional. The 12-month strip moved 0.65 for each 1.00 move in spot, against 0.85 for the front month.
- Do not approve curve-timing rules on a backtest of averages. The pre-specified switching rule trailed the strip at every lookback.
- Monitor the roll gap monthly. For each vehicle, report return against spot plus T-bill income alongside tracking error, and review the vehicle if the gap runs worse than budget for two consecutive quarters.
Limits
- Funds as proxies. The funds stand in for futures strategies. Their returns include management fees of roughly 0.6% to 1.1% a year and fund-specific choices: USO, for example, moved part of its position into later contracts after April 2020. An institutional futures programme with its own roll schedule and costs will differ.
- Spot is a reference. It is not an investable alternative, because holding the physical commodity requires storage.
- Period. The window covers a little over one commodity cycle, plus an oil shock still under way.
- Scope. Inflation hedging against CPI is not tested.
- Independent research on public data. It has not been deployed and is not investment advice.
Sources
Data
- U.S. Energy Information Administration, Cushing, OK WTI Spot Price FOB, daily (series RWTC). Copy used: github.com/datasets/oil-prices, data/wti-daily.csv (ODC-PDDL-1.0), downloaded 26 October 2026.
- U.S. Energy Information Administration, Henry Hub Natural Gas Spot Price, daily (series RNGWHHD). Copy used: github.com/datasets/natural-gas, data/daily.csv (ODC-PDDL-1.0), downloaded 26 October 2026.
- Fund prices, distributions and 3-month Treasury yields: Yahoo Finance and US Treasury. Copy used: huggingface.co/datasets/defeatbeta/yahoo-finance-data (ODC-BY).
Methods referenced
- Gorton, G. and Rouwenhorst, K. G. (2006). "Facts and Fantasies about Commodity Futures." Financial Analysts Journal, 62(2), 47–68. doi.org/10.2469/faj.v62.n2.4083
- Erb, C. B. and Harvey, C. R. (2006). "The Strategic and Tactical Value of Commodity Futures." Financial Analysts Journal, 62(2), 69–97. doi.org/10.2469/faj.v62.n2.4084
Independent research on public data, not investment advice; dollar figures are illustrative. Analysis, code, charts and text were produced with AI assistance and reviewed by the author.