Factor investing is one of the largest product shelves in asset management. Instead of buying the whole market, an allocator can tilt toward stocks with lower volatility, stronger recent momentum, higher quality, cheaper valuations or smaller size. Each tilt rests on decades of academic evidence, and each is sold as a better way to hold equities.
An investment committee approving such a tilt is making a specific bet: that the factor premium will survive fees, crowding and the particular decade it is held through. Thirteen years of live fund returns are now available to test that bet as investors actually experienced it.
I compared five of the largest US factor ETFs with the S&P 500 from August 2013, the first full month all five traded, to September 2026, using monthly total returns with dividends reinvested and each fund's fees already deducted.
Executive summary
The question. Did buying the factor tilt, rather than the market, pay off for an investor who held the actual funds?
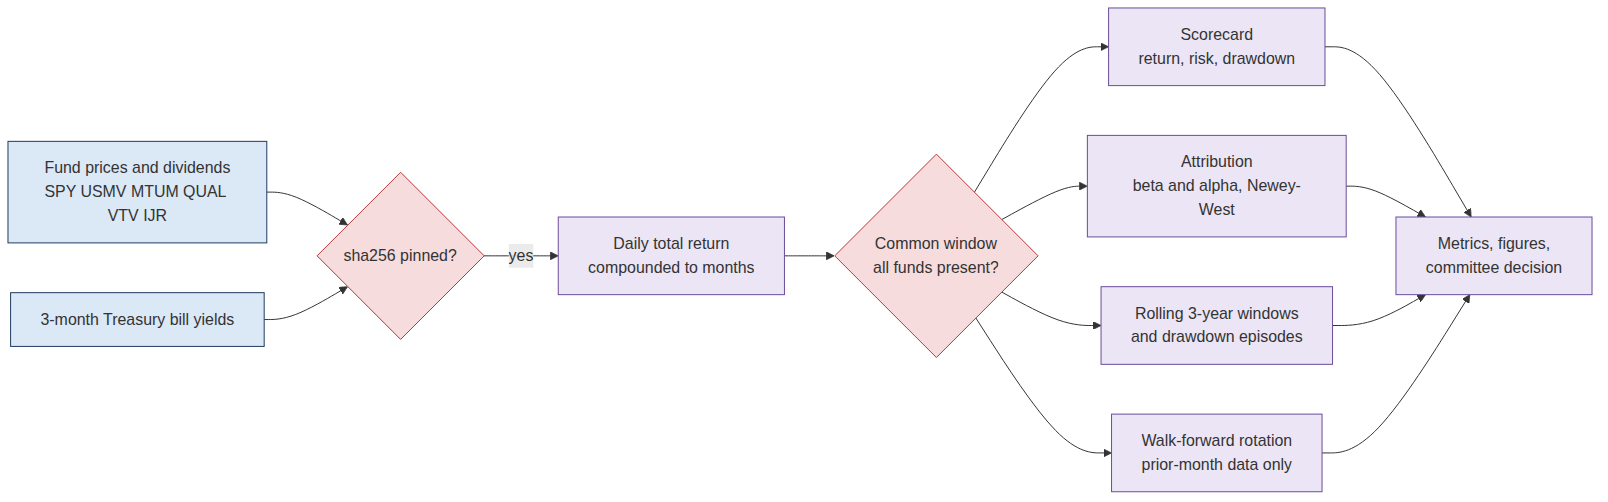
The approach. Monthly total returns for five factor ETFs (low volatility, momentum, quality, value and small cap) and the S&P 500 over 158 months. For each fund: return, risk and drawdown; a split of its gap to the index into the part explained by market exposure (beta) and the part left over (alpha), with standard errors robust to autocorrelation; rolling three-year comparisons; behaviour in the three S&P 500 drawdowns of more than 10%; and a walk-forward test of chasing the best recent factor.
The answer. Four of the five funds trailed the index. Momentum led by 1.6 points a year, but its edge varied from 10.8 points behind to 14.1 points ahead over three-year windows and is not distinguishable from luck. Low volatility returned 10.4% a year against 14.1%; nearly all of the gap is explained by its beta of 0.70 in a rising market. Quality was the S&P 500 with a 2.9% tracking error. Small cap had a negative alpha of 4.5 points a year.
The decision. Treat a factor tilt as a risk choice, not a source of return. Approve low volatility only if the committee wants less equity risk and accepts lower return for it; otherwise hold the index and lower the equity weight. Do not rotate toward recent winners.
Business outcomes
| Decision | Annual return, Aug 2013 – Sep 2026 | $1bn became | What it means |
|---|---|---|---|
| Hold the S&P 500 | 14.1% | $5.66bn | The benchmark every tilt must beat |
| Hold momentum | 15.7% | $6.80bn | The one winner; luck cannot be ruled out (t = 0.9) |
| Hold low volatility | 10.4% | $3.70bn | Lower risk (worst drawdown −19% vs −24%) bought at about 3.6 points a year |
| Hold an equal-weight blend of all five | 12.4% | $4.68bn | Diversifying across tilts did not rescue them: −1.6 points a year |
| Switch each month into last year's best fund | 11.0% vs 13.9% (Sep 2014 – Sep 2026) | $3.55bn vs $4.85bn per $1 in Sep 2014 | Chasing was the worst of the three choices |
Monthly total returns with dividends reinvested, net of each fund's own fees, before investor-level trading costs and taxes. Dollar figures scale one dollar to $1bn; illustrative.
End to end in five steps
| Step | What happens | Output |
|---|---|---|
| 1. Source | Daily prices and dividends for SPY, USMV, MTUM, QUAL, VTV and IJR; daily 3-month Treasury bill yields | Checksum-pinned public data |
| 2. Returns | Daily total return = (price + dividend) / prior price − 1, compounded to months; partial first and last months dropped | 158 common months, Aug 2013 – Sep 2026 |
| 3. Scorecard | Return, volatility, Sharpe ratio, worst drawdown, tracking error, capture ratios | One row per fund |
| 4. Attribution | Regression of each fund's excess return on the S&P 500's, Newey–West errors (6 lags) | Beta, alpha and its t-statistic |
| 5. Decision tests | Rolling 3-year windows, three drawdown episodes, walk-forward rotation into the best trailing fund | What each choice cost or saved |
The data
Prices and dividends for the six funds come from a public mirror of Yahoo Finance daily data, and the risk-free rate is the 3-month Treasury bill yield from the same source. Every raw file is pinned by checksum in the repository.
The five funds are among the largest representatives of each factor: iShares MSCI USA Min Vol Factor (USMV) for low volatility, iShares MSCI USA Momentum Factor (MTUM), iShares MSCI USA Quality Factor (QUAL), Vanguard Value (VTV) and iShares Core S&P Small-Cap (IJR). Fund returns are net of their own expense ratios, which is what an investor actually received.
Two design choices matter. First, the comparison uses only the months all five funds existed, so no fund is flattered by a different start date. Second, value and small cap also have a longer test from February 2004 as a robustness check.
The scorecard
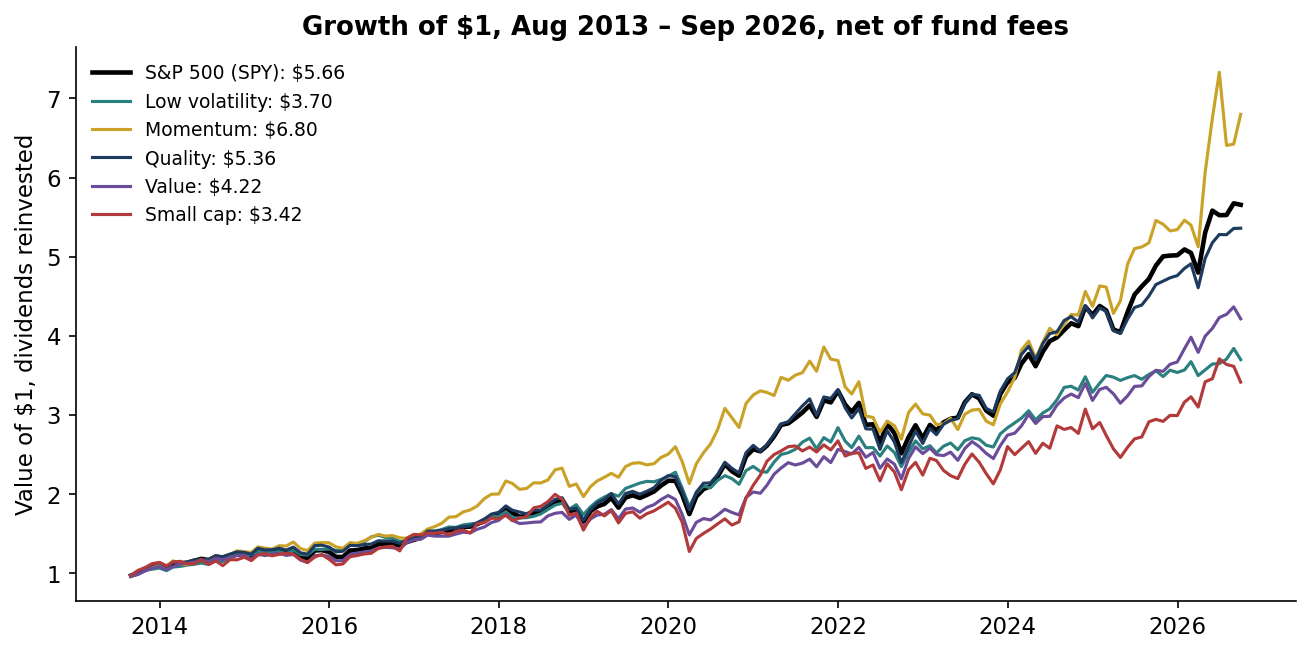
| Fund | Annual return | Volatility | Worst drawdown | Beta | Alpha a year (t) | Share of 3-year windows ahead of the S&P 500 |
|---|---|---|---|---|---|---|
| S&P 500 (SPY) | 14.1% | 14.4% | −23.9% | 1.00 | — | — |
| Momentum (MTUM) | 15.7% | 16.7% | −30.2% | 0.98 | +2.0% (0.9) | 59% |
| Quality (QUAL) | 13.6% | 14.5% | −27.8% | 0.99 | −0.3% (−0.4) | 37% |
| Value (VTV) | 11.5% | 13.8% | −25.1% | 0.87 | −0.7% (−0.4) | 17% |
| Low volatility (USMV) | 10.4% | 11.6% | −19.1% | 0.70 | +0.1% (0.1) | 27% |
| Small cap (IJR) | 9.8% | 19.4% | −36.1% | 1.12 | −4.5% (−1.4) | 23% |
| Equal-weight blend | 12.4% | 13.9% | −22.0% | 0.93 | −0.7% (−0.6) | 28% |
Aug 2013 – Sep 2026, 158 months; 123 rolling 3-year windows. Alpha is the annualised intercept from regressing monthly fund excess returns on S&P 500 excess returns over T-bills (1.9% a year on average); t-statistics use Newey–West errors with 6 lags. A t-statistic below about 2 means the alpha cannot be told apart from zero.
Where the gap came from
A fund can trail the index for two different reasons. It may simply hold less market: a fund with a beta of 0.70 should earn about 70% of the market's excess return over cash. Or it may add or lose value beyond that exposure, which is its alpha. Separating the two is the difference between a cheap risk dial and a skill worth paying for.
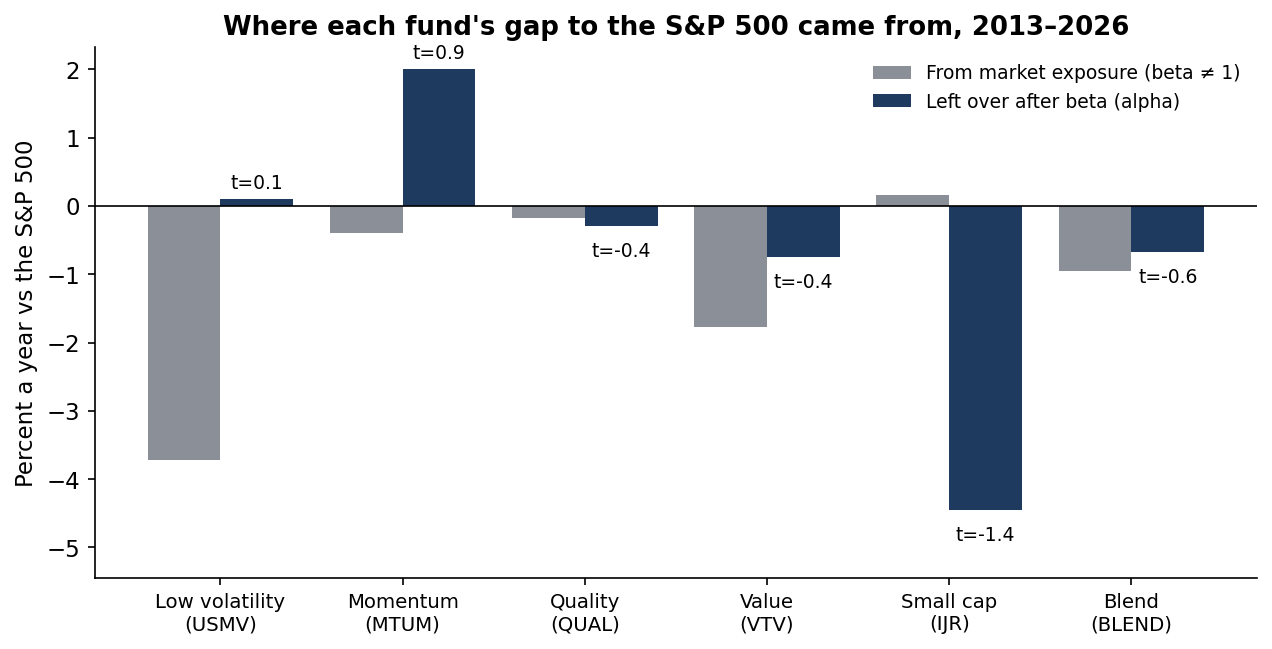
Low volatility is the clearest case. It trailed by 3.6 points a year, and its lower beta explains 3.7 of them. What remains is an alpha of 0.1 points with a t-statistic of 0.1. The fund behaved exactly like 70% of the market plus 30% cash. That is a legitimate product, but a committee could have built it by holding less equity. A mix of 70% S&P 500 and 30% Treasury bills, rebalanced monthly to the same beta, returned 10.5% a year with 10.0% volatility and a worst drawdown of −16.8%: slightly more return, less risk and no factor fee.
Quality, at the other extreme, had a beta of 0.99 and an R² of 0.96. Over thirteen years it was the S&P 500 with a small tracking error. Small cap was the only fund with a large negative alpha, 4.5 points a year, and it also fell further than the index in two of the three drawdowns.
Momentum's 2.0 points of alpha are the only positive result of any size. With a t-statistic of 0.9, though, an edge this large would appear by chance often enough that it cannot be treated as reliable, and part of its lead came in the final year of the sample.
Through time
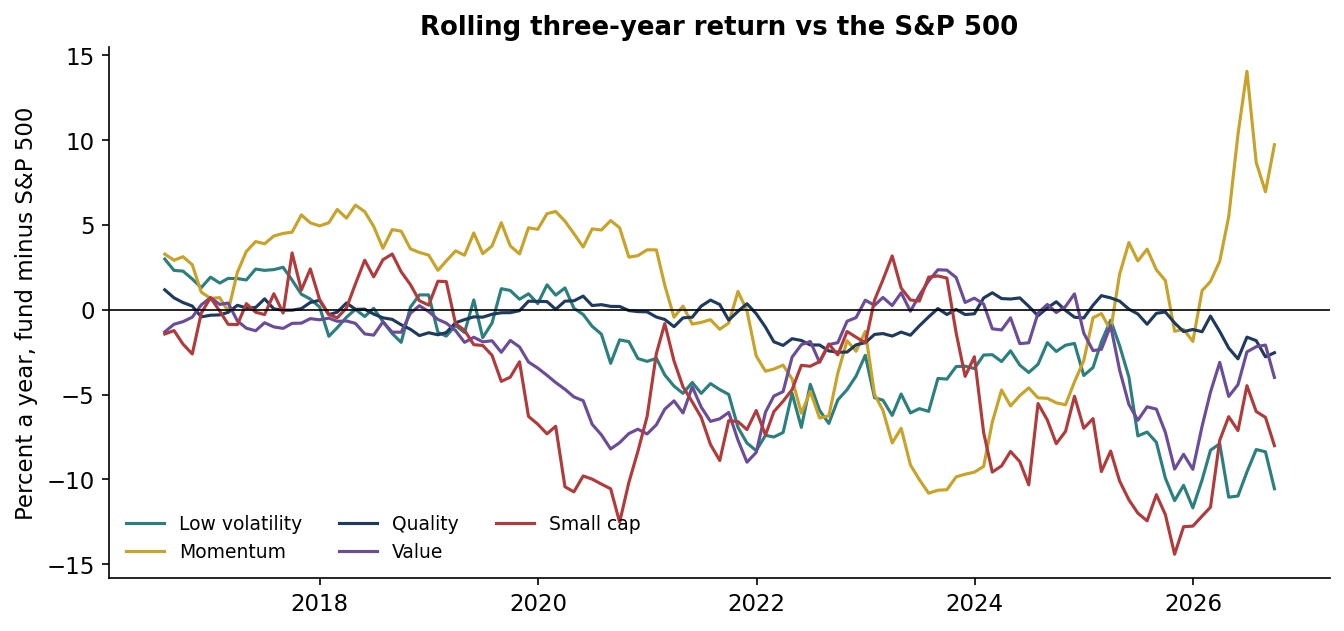
No tilt led consistently. Momentum was ahead for most of 2016–2020, fell more than 10 points behind in 2023, then led sharply in 2026. Value and small cap trailed in most windows. An investor reviewing any of these funds after three years would have reached a different verdict depending on the start date, which is the practical problem with judging factors on short records.
In the drawdowns
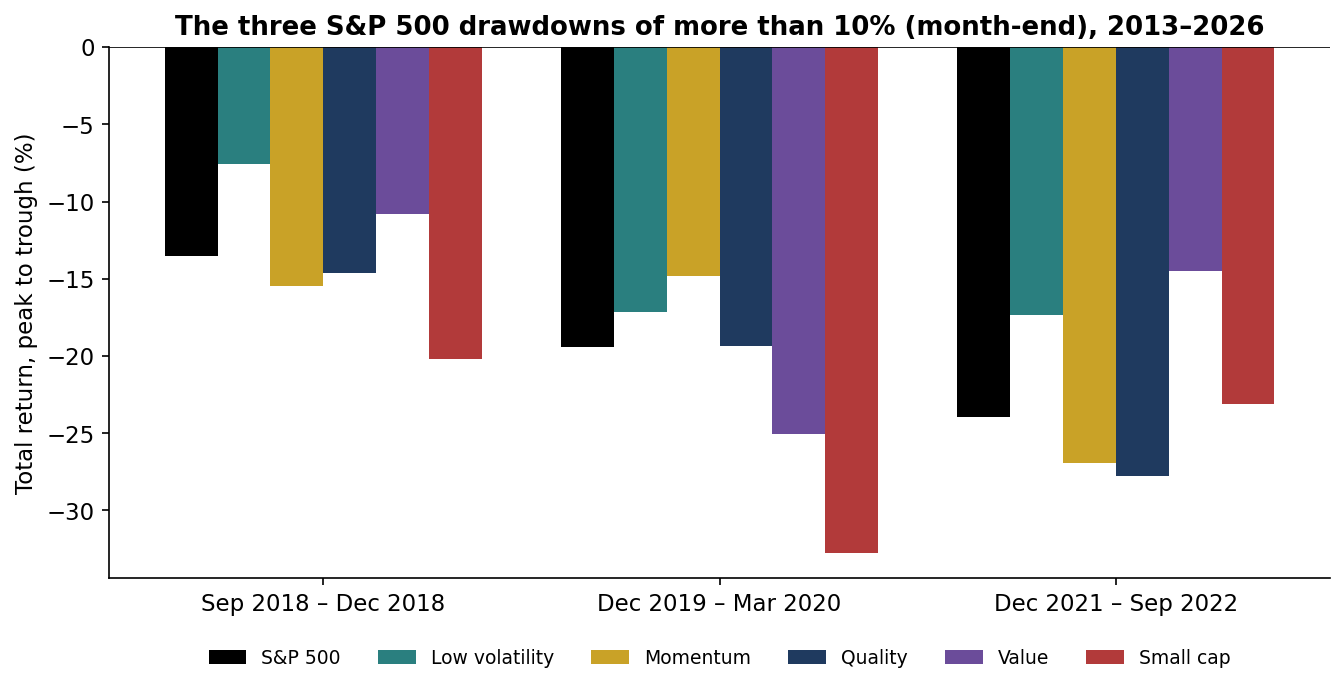
| Drawdown | S&P 500 | Low volatility | Momentum | Quality | Value | Small cap |
|---|---|---|---|---|---|---|
| Sep – Dec 2018 | −13.5% | −7.6% | −15.4% | −14.6% | −10.8% | −20.2% |
| Dec 2019 – Mar 2020 | −19.4% | −17.2% | −14.8% | −19.3% | −25.1% | −32.8% |
| Dec 2021 – Sep 2022 | −23.9% | −17.3% | −26.9% | −27.8% | −14.5% | −23.1% |
Month-end total returns from the S&P 500's prior peak to its trough.
Low volatility protected in all three episodes, most in 2018 and least in the pandemic sell-off, when it fell 17.2% against 19.4%. Value protected in 2022 and failed badly in 2020. Quality did not protect at all in 2022. The lesson for a risk committee is that only the low-beta fund offered dependable downside protection, and that is the property the committee could have bought directly.
Chasing the winner
The most common way factor tilts are actually managed is by looking at what worked recently. I tested that rule walk-forward: at each month-end, hold next month whichever of the five funds had the best return over the previous 12 months, using only information available at the time.
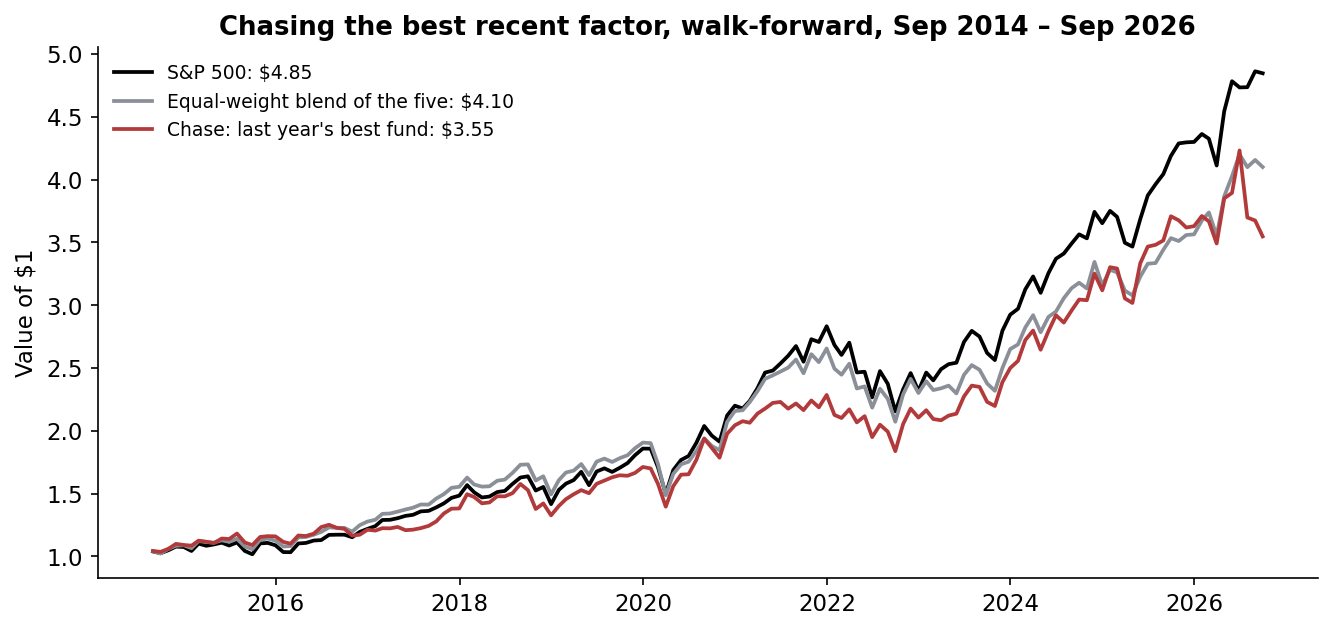
The chasing rule returned 11.0% a year from September 2014, against 12.3% for the equal-weight blend and 13.9% for the S&P 500. It switched funds 33 times and arrived in each new leader after much of its run. With a 36-month look-back the rule did better, 13.5% a year, but still trailed the index's 15.0% over the same months and fell 31% at its worst.
The commercial case
The product a client would pay for is a factor-tilt audit. It takes each tilt, smart-beta fund or active manager in an allocator's equity book and answers one question: how much of the result is market exposure the client could buy for a few basis points, and how much is something else? It then sets review rules that prevent decisions based on short, noisy records.
| Element | What it is | Basis |
|---|---|---|
| Who pays | OCIOs, pension and endowment CIOs, wealth platforms with model portfolios, multi-asset manager-research teams | Budget holders: CIO, head of manager research |
| The problem in dollars | An equal-weight factor blend gave up 1.6 points a year: about $16M a year per $1bn. Chasing recent winners gave up 2.9 points: about $29M a year per $1bn | This study's results (illustrative) |
| The product | Per holding: beta, alpha and its reliability, capture ratios, drawdown behaviour, rolling record; a policy for when a tilt is reviewed | This repository is the working prototype |
| Proof | Thirteen years of live fund returns net of fees, attribution with robust errors, walk-forward rules | Public code and data |
| Build vs buy | 2–3 weeks to load a client's holdings and returns; alternatives are vendor style analytics and consultant reviews | Illustrative effort |
| Pricing logic | 1–2 basis points of assessed assets ($100–200k a year per $1bn), about 1% of the value at stake | Illustrative |
| What could stop adoption | Committees that already own the tilts may resist a finding that they paid for beta | Present as a risk budget, not a verdict on past decisions |
| How a client judges it | Fees saved on beta-only products, rotation trades avoided, drawdown matched to the risk budget | Reported each review |
All prices and effort figures are illustrative assumptions with their arithmetic shown. Value figures come from this project's results; they are not a forecast for any firm.
Recommendations
- Decompose before approving. For every tilt or active equity product, report beta and alpha with its t-statistic. Pay active fees only for alpha that survives.
- Buy low risk directly. If the goal is a smaller drawdown, compare the low-volatility fund with simply holding less equity. Over this period a 70/30 index-and-bills mix matched its beta and did slightly better on return, volatility and drawdown.
- Set the review horizon in advance. A factor's three-year record ranged from 10 points behind to 14 points ahead of the index. Judge tilts over full cycles, with the expected range of outcomes written into the mandate.
- Ban rotation on recent performance. Moving into last year's winner cost 2.9 points a year here.
- Monitor what you hold. Track each tilt's rolling beta and tracking error; a fund that drifts back to the index, as quality did, no longer justifies its fee.
Limits
- One period. Thirteen years dominated by a strong US large-cap market. Over February 2004 – September 2026, value and small cap still trailed the S&P 500 by 1.3 and 1.2 points a year, but other decades favoured these factors.
- One fund per factor. Different index providers define each factor differently; results for other products will differ.
- Few independent observations. Rolling windows overlap, and 158 months cannot pin down an alpha of a point or two.
- No investor costs or taxes. Fund fees are included; trading costs and taxes for the rotation rule are not, and would widen its shortfall.
- Not a recommendation. Independent research on public data. It has not been deployed and is not investment advice.
How it was built
Sources
Data
- Daily prices and dividends for SPY, USMV, MTUM, QUAL, VTV and IJR, and US Treasury daily par yields: via huggingface.co/datasets/defeatbeta/yahoo-finance-data (ODC-BY).
Methods referenced
- Sharpe, W. F. (1964). "Capital Asset Prices: A Theory of Market Equilibrium under Conditions of Risk." Journal of Finance 19(3), 425–442.
- Jensen, M. C. (1968). "The Performance of Mutual Funds in the Period 1945–1964." Journal of Finance 23(2), 389–416.
- Newey, W. K. and West, K. D. (1987). "A Simple, Positive Semi-Definite, Heteroskedasticity and Autocorrelation Consistent Covariance Matrix." Econometrica 55(3), 703–708.
- Fama, E. F. and French, K. R. (1993). "Common Risk Factors in the Returns on Stocks and Bonds." Journal of Financial Economics 33(1), 3–56.
- Jegadeesh, N. and Titman, S. (1993). "Returns to Buying Winners and Selling Losers: Implications for Stock Market Efficiency." Journal of Finance 48(1), 65–91.
- Frazzini, A. and Pedersen, L. H. (2014). "Betting Against Beta." Journal of Financial Economics 111(1), 1–25.
- Asness, C. S., Frazzini, A. and Pedersen, L. H. (2019). "Quality Minus Junk." Review of Accounting Studies 24(1), 34–112.
Independent research on public data, not investment advice; dollar figures are illustrative. Analysis, code, charts and text were produced with AI assistance and reviewed by the author.