The inverted yield curve is the best-known recession warning in finance. When short-term Treasury rates rise above long-term ones, a recession has usually followed. It is watched by central banks, investment committees and financial television alike.
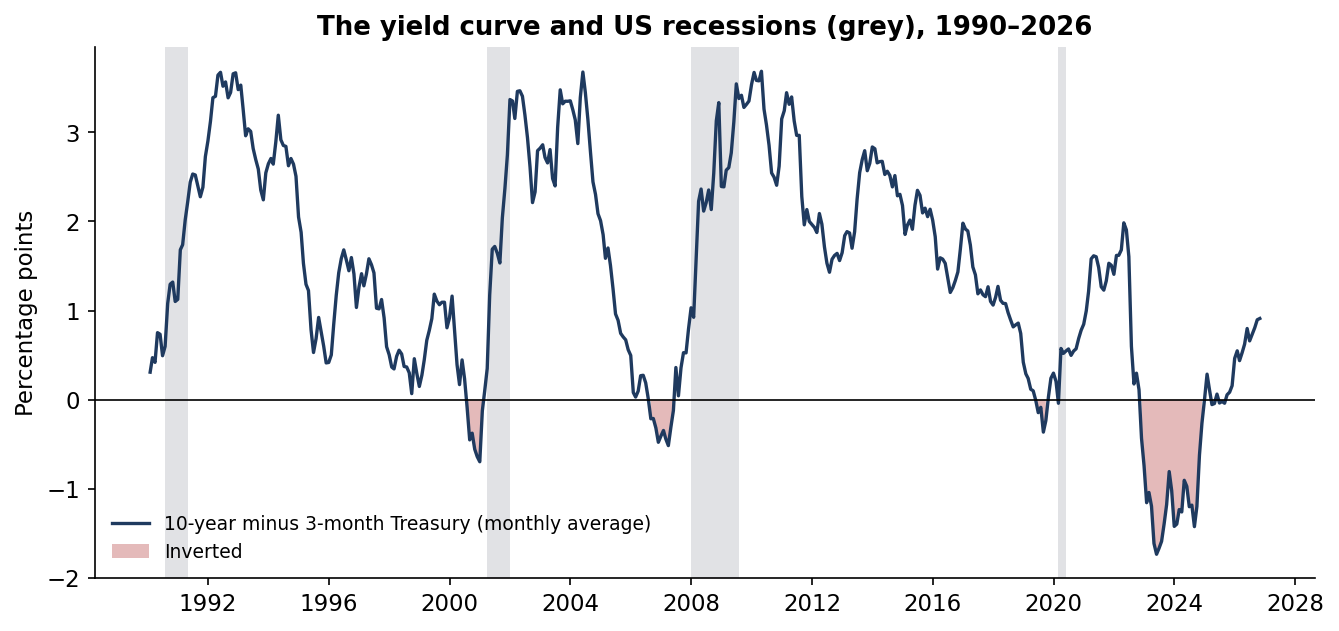
The curve inverted in late 2022 and stayed inverted for 25 months, by up to 1.7 percentage points. That was the deepest inversion in the record since 1990. Yet through October 2026 the National Bureau of Economic Research had dated no recession. Two questions follow, one for economists and one for investors. Does the signal still work? And should an investor act on it?
I tested both on the official daily Treasury curve from 1990, NBER recession dates and S&P 500 total returns from 1996.
Executive summary
The question. Does an inverted yield curve still predict US recessions? Would moving out of stocks on the signal have helped an investor?
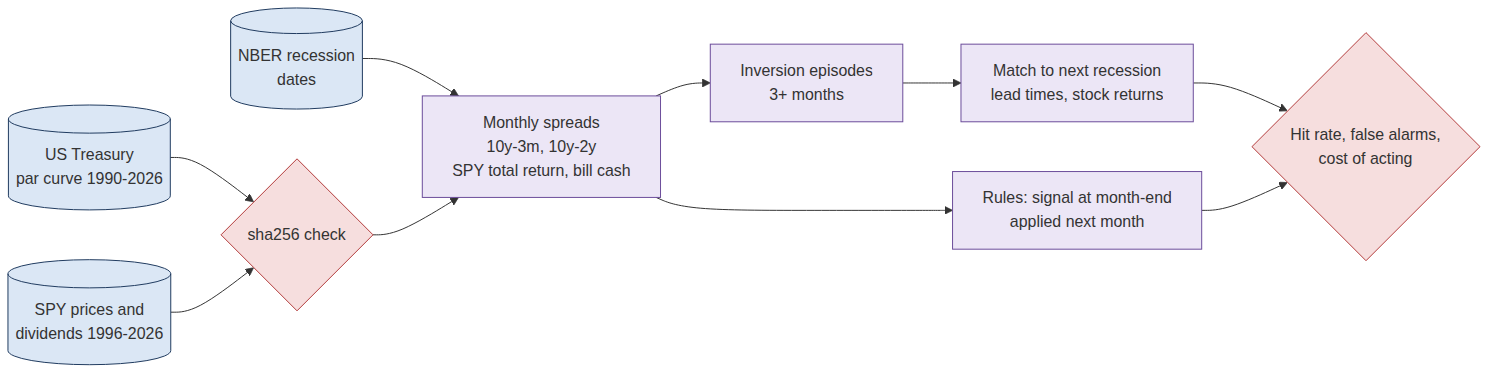
The approach. I measured the 10-year minus 3-month Treasury yield as a monthly average from January 1990 to October 2026. This is the spread the New York Fed uses in its recession model. I identified every inversion of at least three months and matched each to the next NBER recession. Then I tested three simple rules that move an S&P 500 holding (SPY, with dividends) into Treasury bills. Each rule acts the month after the signal, so there is no hindsight. The 10-year minus 2-year spread serves as a check.
The answer. The signal has a real but patchy record.
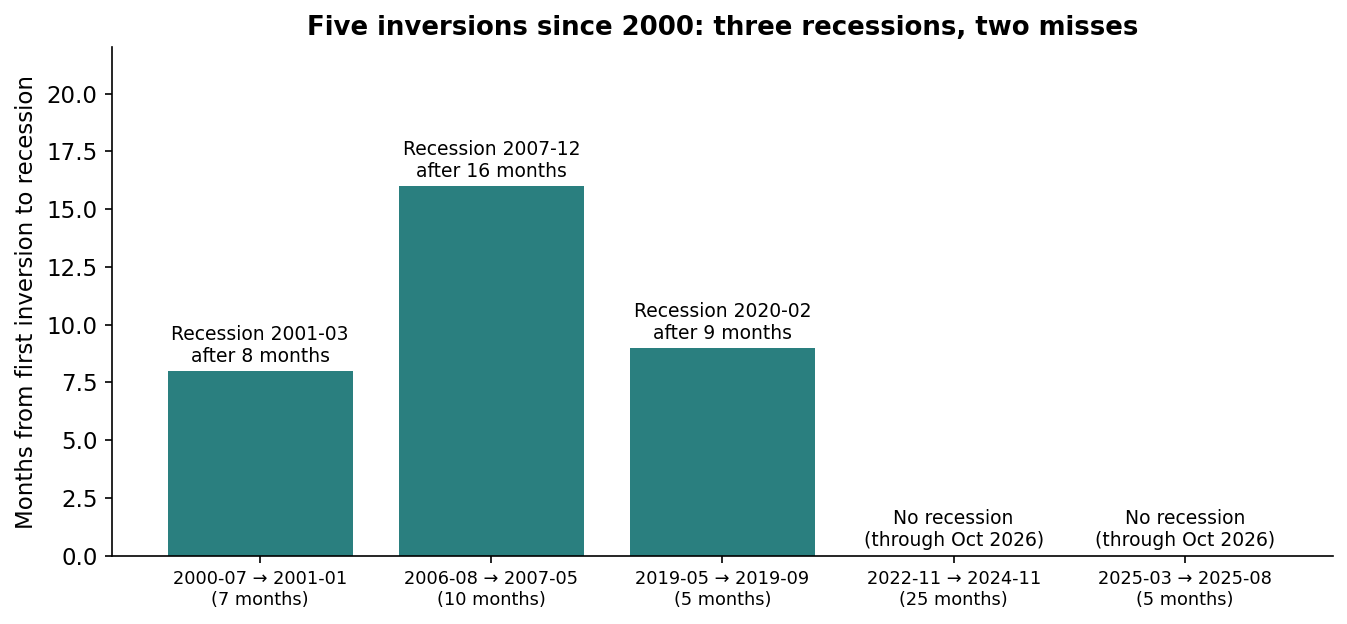
- Three of five inversions since 2000 were followed by recession, after 8, 16 and 9 months. The 2020 recession was caused by a pandemic, not anything the curve foresaw.
- The deepest inversion, 2022–24, and a shallow one in 2025 were followed by no recession through October 2026.
- Stocks often rose between the inversion and the recession.
- Moving to cash while the curve was inverted cost 1.1 points a year and did not reduce the worst drawdown. The 2008 crash came after the curve had already un-inverted.
The decision it supports. Treat an inverted curve as a prompt to review economic and portfolio risk, not as an instruction to sell. Judge any macro signal by the decision it drives, including the cost of its false alarms.
Business outcomes
| Decision | Buy and hold SPY | Cash while inverted | Cash for 12 months after un-inversion | What it means |
|---|---|---|---|---|
| Annual return, Feb 1996 – Oct 2026 | 10.3% | 9.2% | 9.9% | Acting on inversion cost money |
| $1 grew to | $20.6 | $15.1 | $18.4 | $5.5bn less per $1bn over 30 years for the obvious rule |
| Worst drawdown | −50.8% | −50.8% | −46.3% | Inversion did not avoid 2008, which came after un-inversion |
| Volatility | 15.2% | 14.1% | 13.8% | Less risk only because of time in cash |
| Sharpe ratio | 0.52 | 0.48 | 0.54 | No reliable improvement |
| Time in cash | 0% | 14% | 15% | About one month in seven |
Signals are monthly averages known at month-end and applied the next month. Cash earns the prior month's average 3-month bill yield. No trading costs or taxes. With only three recession-linked signals in the equity sample, differences of a fraction of a point are not reliable.
End to end in five steps
| Step | What happens | Output |
|---|---|---|
| 1. Source | US Treasury daily par yield curve (1990–2026), SPY prices and dividends (1996–2026), NBER recession months | Checksum-pinned public data |
| 2. Measure | Monthly average of 10-year minus 3-month (and 10-year minus 2-year) | 442 months of spreads |
| 3. Episodes | Inversions of at least 3 months, merged if less than 3 months apart; next recession within 24 months | Five episodes since 2000 |
| 4. Decide | Three rules moving SPY to T-bills, each acting the month after the signal | Returns, drawdowns, time in cash |
| 5. Judge | Hit rate, lead time, stock returns after each signal, cost of acting | Is it a warning, a trade, or both? |
The data
The yield curve is the U.S. Treasury's official daily par yield curve, which starts in January 1990. Stock returns are the SPDR S&P 500 ETF (SPY) with dividends reinvested, from 1996 in this source. Cash is the 3-month Treasury bill. All three are pinned by checksum. Recession dates are the NBER's official peaks and troughs.
The main measure is the 10-year yield minus the 3-month yield. Research has found this spread among the best recession predictors (Estrella and Mishkin, 1998), and the New York Fed's recession model uses it. A daily dip can be noise, so I average each month and require three inverted months before calling an episode.
The record
| Inversion (10y − 3m) | Months | Deepest | Recession | Lead | S&P 500 to recession start | S&P 500 next 12 months | Worst drawdown, next 24 months |
|---|---|---|---|---|---|---|---|
| Jul 2000 – Jan 2001 | 7 | −0.70 pp | Mar 2001 | 8 months | −14% | −15% | −33% |
| Aug 2006 – May 2007 | 10 | −0.52 pp | Dec 2007 | 16 months | +19% | +16% | −17% |
| May 2019 – Sep 2019 | 5 | −0.36 pp | Feb 2020 (Covid) | 9 months | +11% | +1% | −19% |
| Nov 2022 – Nov 2024 | 25 | −1.73 pp | None through Oct 2026 | n/a | n/a | +10% | −8% |
| Mar 2025 – Aug 2025 | 5 | −0.06 pp | None through Oct 2026 | n/a | n/a | +17% | −6% |
The 10-year minus 2-year spread gives three episodes (2000, 2006–07, 2022–24) and the same pattern. A probit model of recession in the next 12 months on the spread, fitted in-sample from 1990 to 2025, has a pseudo-R² of only 0.05.
The record is better than a coin toss and worse than its reputation. The lead times, from 8 to 16 months, are long and variable. That makes the signal hard to act on even when it is right. The 2019 hit owes something to luck: the recession that followed was caused by a pandemic.
What stocks did
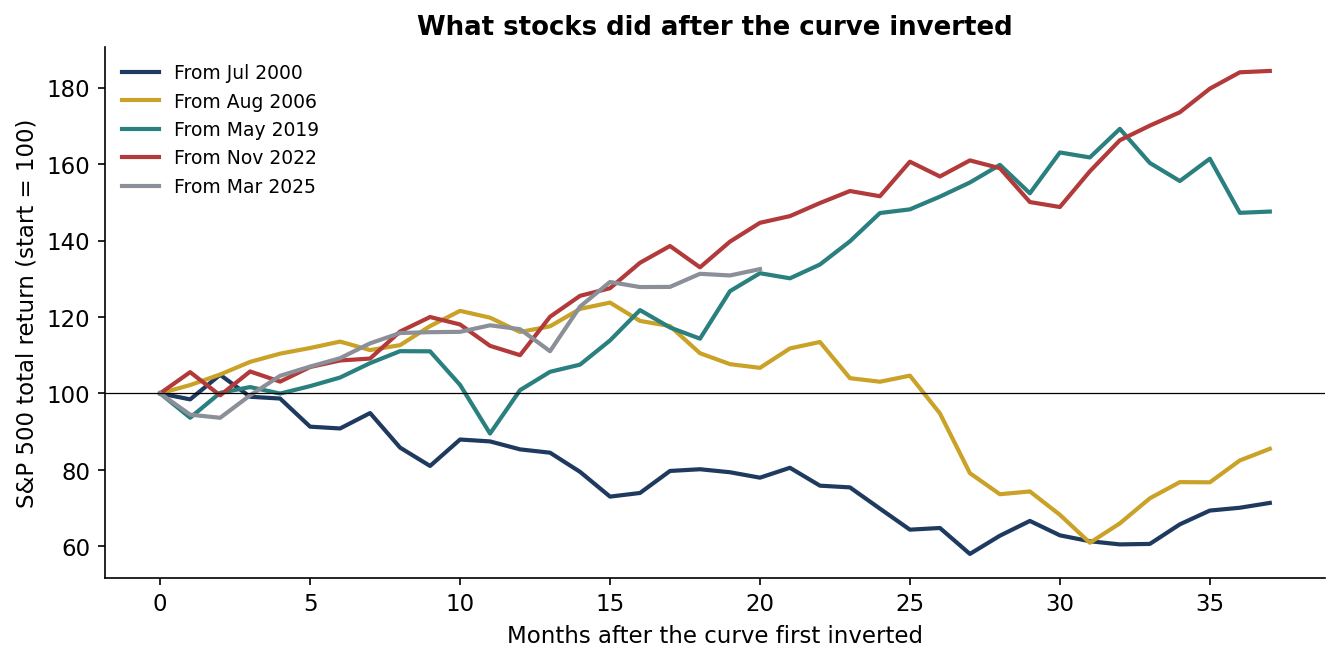
An inversion is not a sell signal for stocks. In 2006 the S&P 500 rose 19% between the inversion and the start of the recession. It rose 11% in 2019, and 49% from December 2022 to December 2024. Only the 2000 inversion, which arrived as the dot-com bubble was already deflating, was followed by an immediate decline.
Acting on the signal
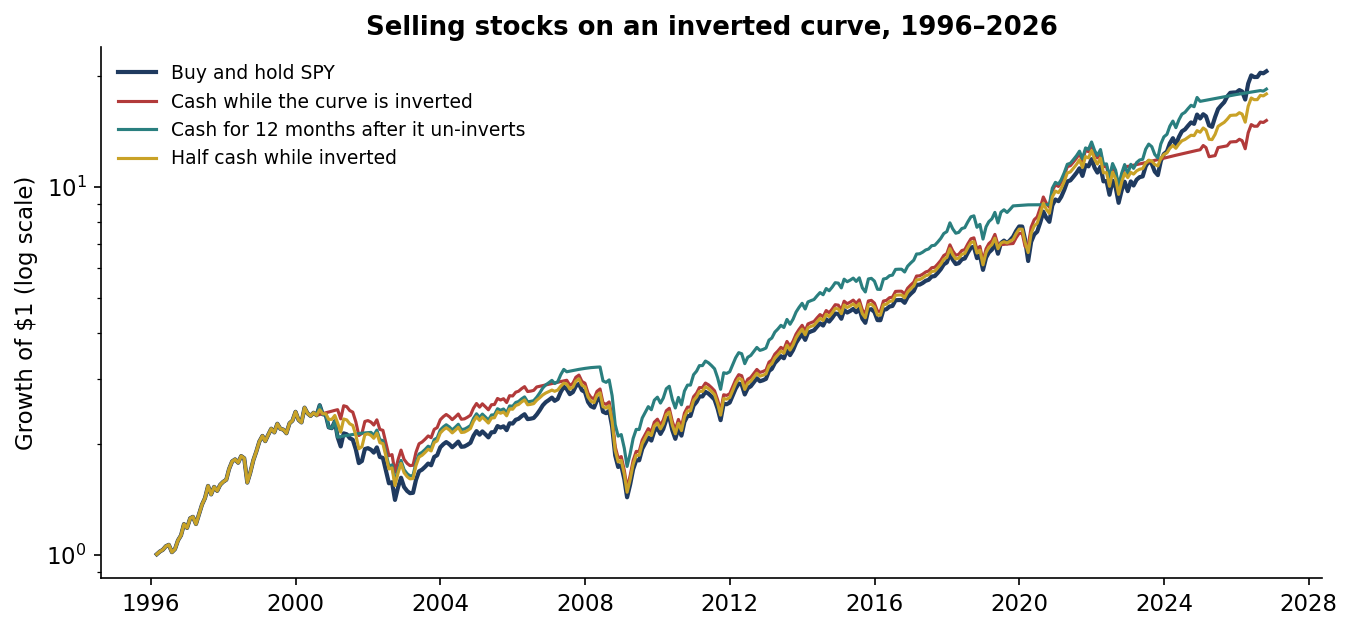
The obvious rule holds T-bills whenever the curve is inverted. It turned $1 into $15.1 against $20.6 for buy and hold, and it did not avoid the worst loss. In 2007 the curve un-inverted in June, months before stocks peaked. The rule was fully invested for the 2008 crash.
A less obvious rule did better. It holds cash for the 12 months after the curve turns positive again, because un-inversion has historically come close to the recession itself. It earned 9.9% a year, with a smaller worst drawdown (−46%) and a slightly better Sharpe ratio. With only three useful signals in thirty years, I would not rely on that difference.
Why the signal missed in 2022–24
An inverted curve reflects what bond markets expect. When the central bank pushes short-term rates up to fight inflation, long-term rates stay lower because investors expect cuts later. That usually happens because growth will slow.
In 2022–23 the Fed raised rates unusually fast after an inflation surge. Many households and companies had locked in low long-term borrowing costs during 2020–21, so higher short rates hurt them less than in past cycles. The signal measured expectations correctly; the economy did not follow the usual script. That is a reason to treat any single indicator with humility.
Where the curve is today
In October 2026 the 10-year yield averaged 0.91 points above the 3-month bill, and 0.39 points above the 2-year note. The curve is upward-sloping again. On its own, it is not flashing a warning. The same caution applies in reverse: a normal curve is not a guarantee of growth.
The commercial case
The deliverable a client would pay for is a macro signal audit. It takes the indicators an investment committee already watches, such as the yield curve, unemployment rules, purchasing managers' surveys and credit spreads, and tests each against the decision it would drive. It reports hit rates, false alarms, lead times and the dollar cost of acting, and maintains a current scorecard.
| Element | What it is | Basis |
|---|---|---|
| Who pays | OCIOs and investment consultants; pension, endowment and foundation CIOs; wealth platforms writing house views; family offices | Budget holders: CIO, head of investment strategy |
| The problem in dollars | Acting on inversion turned $1bn into $15.1bn instead of $20.6bn over 30 years; over Dec 2022 – Dec 2024 alone, cash instead of stocks gave up about $370M per $1bn | This study's results (illustrative) |
| The product | A scorecard per indicator: episodes, lead times, false alarms, decision backtest after costs, current reading | This repository is the working prototype |
| Proof | 36 years of curve data, 30 years of equity returns, rules fixed in advance, reproducible | Public code and data |
| Build vs buy | 3–4 weeks to cover a client's indicator set with one quant | Illustrative effort |
| Pricing logic | $20–40k per indicator review, or $75k a year for a quarterly macro-signal monitor | Illustrative |
| What could stop adoption | Few recessions per indicator make every result fragile | Present as evidence with its sample size, not as proof |
| How a client judges it | De-risking decisions avoided or made, false alarms caught, committee time saved | Reported per review |
All prices and effort figures are illustrative assumptions with their arithmetic shown. Value figures come from this project's results; they are not a forecast for any firm.
Recommendations
- Use inversion as a review trigger. When the curve inverts, check liquidity, stress tests and rebalancing rules. Do not sell on the signal alone.
- Judge signals by decisions. Report every macro indicator's false alarms and the cost of acting on them, not only its hits.
- Size to survive, not to time. Hold an equity allocation the portfolio can keep through a recession, so no timing call is needed.
- Watch un-inversion, not just inversion. Historically, recessions began closer to the curve turning positive again than to the first inversion.
- Combine evidence. A single indicator, however famous, rests on a handful of episodes.
Limits
- Few events. Four US recessions since 1990 and five inversions since 2000. Every statistic here rests on a handful of cases.
- A possible late call. Recessions are dated months after they begin, so the 2022–24 miss is provisional.
- Equity history. SPY starts in 1996 in this source, so the 1989 inversion before the 1990 recession is outside the equity test.
- No costs or taxes in the rules. Including them would widen the gap in favour of buy and hold.
- Not a trade recommendation. This is independent research on public data. It has not been deployed and is not investment advice.
How it was built
Sources
Data
- US Treasury daily par yield curve, and SPY daily prices and dividends: via huggingface.co/datasets/defeatbeta/yahoo-finance-data (ODC-BY).
- US business-cycle peaks and troughs: NBER Business Cycle Dating Committee, nber.org/research/business-cycle-dating.
Research
- Estrella, A. and Mishkin, F. S. (1998). "Predicting U.S. Recessions: Financial Variables as Leading Indicators." Review of Economics and Statistics 80(1), 45–61.
- Estrella, A. and Hardouvelis, G. A. (1991). "The Term Structure as a Predictor of Real Economic Activity." Journal of Finance 46(2), 555–576.
- Harvey, C. R. (1988). "The Real Term Structure and Consumption Growth." Journal of Financial Economics 22(2), 305–333.
- Federal Reserve Bank of New York. "The Yield Curve as a Leading Indicator."
Independent research on public data, not investment advice; dollar figures are illustrative. Analysis, code, charts and text were produced with AI assistance and reviewed by the author.