The 10-year Treasury closed at 5.12% on 20 October and the 30-year at 5.42%. Sovereign markets are reminding everyone how fast long yields can move: the French 10-year spread over Bunds widened close to 25 basis points in two days this month, and commentary on hedge-fund crowding in government bonds is back. For a bank's ALM committee, an insurer, a pension or a rates desk carrying long-dated exposure, the practical question is not where yields go next. It is how much of the book is actually hedged, and what risk is left when the hedge is done.
Most long-end exposure is hedged where liquidity is: futures and on-the-run bonds in the 2- to 10-year sector. This note tests what that leaves behind, walk-forward, on the US Treasury's own daily par yield curve from 1990 to yesterday's close. The answer changes how I would set hedge ratios and what I would ask a risk committee to limit.
Executive summary
The question. If a long-duration Treasury exposure is hedged with the 2-, 5- and 10-year points, how much risk is left, what kind of risk is it, and which hedge ratio leaves the least?
The approach. A $1bn constant-maturity 30-year position, hedged five ways and compared with leaving it open. Every hedge ratio is set on the first trading day of each month using only the prior three years of data, then held for the month. The test runs from January 1994 to October 2026: 6,691 trading days and 322 monthly refits.
The answer. The industry-default duration hedge removes 84% of the variance, but what remains is not noise. It is a short-10s, long-30s curve position worth about $1.7M per basis point, which made $68M in 2022 and lost $31M in March 2023 on a book that was nominally hedged. A minimum-variance regression hedge leaves 18% less risk (95% confidence interval: 16% to 21% less), lowers one-day 99% VaR from $10.5M to $8.3M, and is lower in every one of the 28 calendar years tested and in every stress window. A three-factor curve hedge, the most sophisticated rule tested, left 37% more risk than the simple one.
The decision it supports. Replace one-for-one DV01 matching with a regression-based hedge ratio refit monthly, keep the duration hedge as the reference, cap gross hedge DV01, and put an explicit limit on residual 10s30s exposure rather than treating a DV01-flat book as risk-free.
Business outcomes
| Business lever | Duration-matched hedge today | Minimum-variance hedge | What it means |
|---|---|---|---|
| Risk left on a $1bn 30-year book | $60.4M a year of residual volatility | $49.3M | 18% less unexplained P&L for the same exposure |
| One-day 99% VaR | $10.5M | $8.3M | A smaller loss on the bad day the limit is written for |
| Risk capital (illustrative) | $99.9M | $79.0M | $20.9M less capital per $1bn at 3 x 10-day VaR |
| Cost of that capital (illustrative) | $10.0M a year | $7.9M a year | About $2.1M a year per $1bn at a 10% hurdle |
| Rebalancing cost (illustrative) | About $10k a year | About $166k a year | Small next to the capital saved |
| What the residual is | A 10s30s curve position nobody chose | Mostly diversifiable noise | Hedged means hedged, not a hidden steepener or flattener |
| Stress behaviour | $27.1M worst day in March 2023 | $7.2M | The hedge holds when liquidity and the curve move together |
Walk-forward test, January 1994 to October 2026 (paused February 2002 to March 2008 while the 30-year series was suspended and fresh history accumulated). Capital = 3 x the square root of 10 x one-day 99% historical VaR, a Basel-style convention used only for illustration. Cost of capital assumed at 10%. Rebalancing cost assumed at 0.25bp per dollar of DV01 traded at each monthly refit. All dollar figures per $1bn of 30-year market value and scale linearly.
End to end in six steps
| Step | What happens | Output |
|---|---|---|
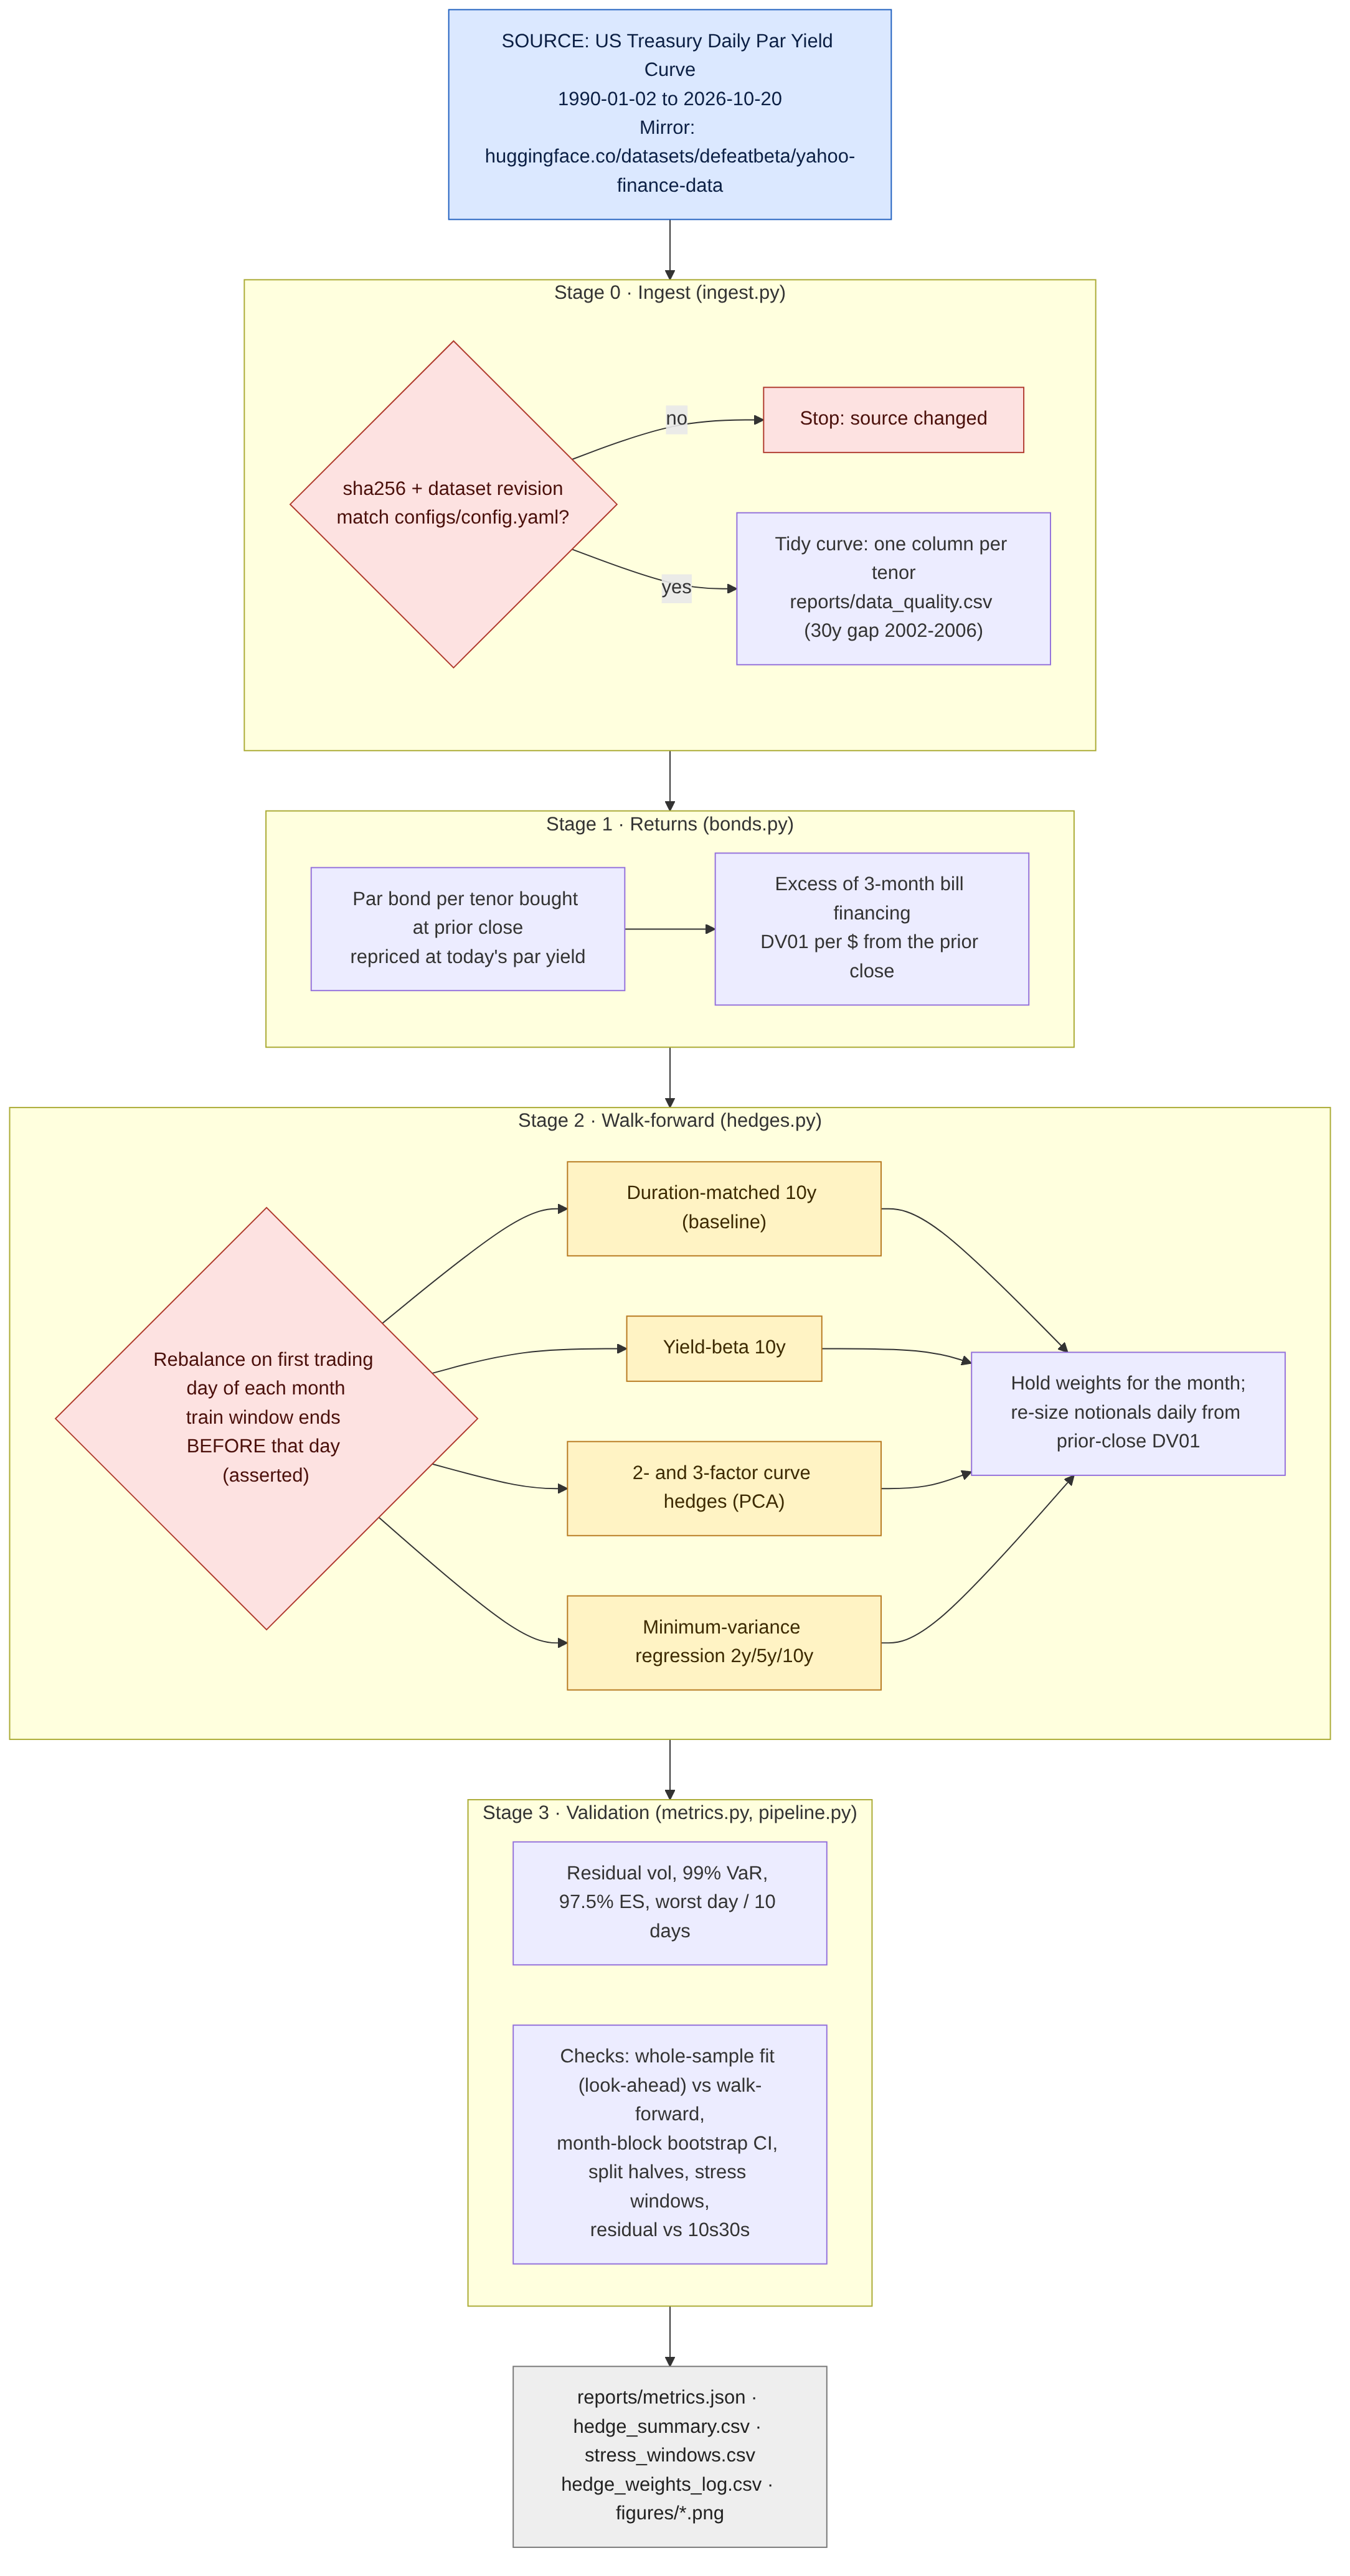
| 1. Source | Download the US Treasury daily par yield curve from a pinned mirror; verify sha256 and dataset revision | 9,207 days, 1990 to 20 October 2026 |
| 2. Clean | One column per tenor; record missing data, including the 30-year suspension from February 2002 to February 2006 | Data-quality report |
| 3. Returns | Each curve point priced as a par bond bought at the prior close; every leg financed at the 3-month bill rate | Daily excess returns and DV01 for 2, 5, 10 and 30 years |
| 4. Hedge rules | Duration-matched, yield-beta, two- and three-factor curve hedges, minimum-variance regression | Monthly hedge weights from data before each refit date |
| 5. Walk-forward test | Hold weights for the month, re-size daily from prior-close DV01, record residual P&L | 6,691 out-of-sample days, 322 refits |
| 6. Decide | Residual risk, VaR, expected shortfall, stress windows, bootstrap confidence, look-ahead comparison | Hedge rule, limits and controls |
The data, and the position being tested
The source is the official US Treasury daily par yield curve, the same series the market and regulators use, published every business day for maturities from one month to 30 years. The copy used here is a public mirror pinned to a specific revision and checksum, so every number in this note can be reproduced byte for byte. It runs from 2 January 1990 to 20 October 2026.
The position is $1bn of constant-maturity 30-year Treasury exposure. At today's 5.42% yield its DV01 is about $1.47M per basis point. It stands in for anything long and rate-sensitive: an insurer's liability-matching portfolio, a bank's long securities book, the fixed leg of a long swap, or a rates desk's long-end inventory. The hedges use the 2-, 5- and 10-year points, where futures and on-the-run bonds are deepest.
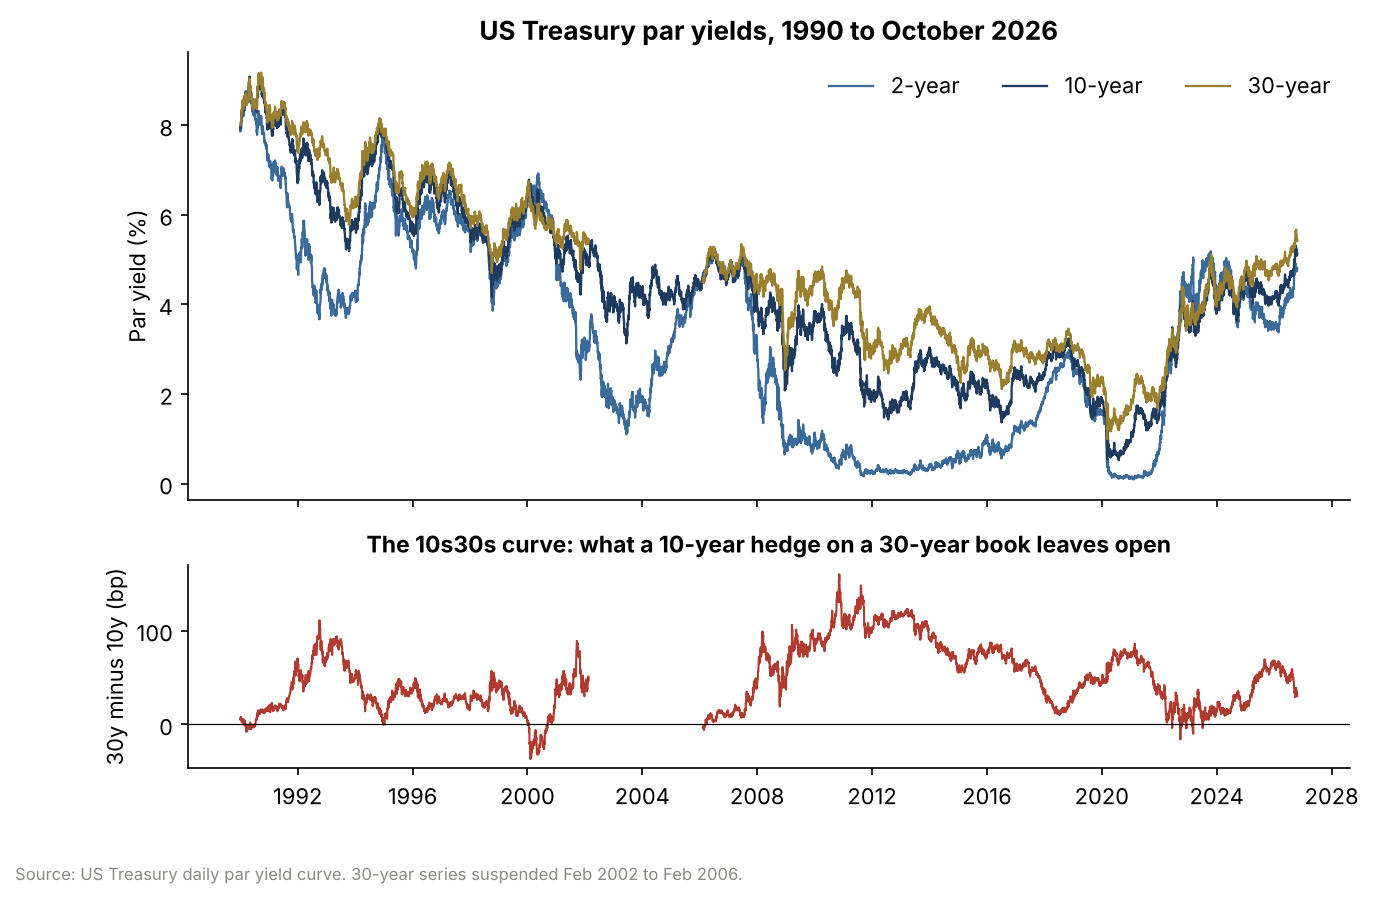
How returns and hedge ratios are built
| Element | How it is built | Why it matters |
|---|---|---|
| Par-bond return | Bond with coupon equal to yesterday's par yield, repriced at today's yield for the same tenor | The standard way to turn a constant-maturity yield series into a tradable-equivalent return |
| Financing | Every leg earns or pays the 3-month bill rate | Hedge P&L reflects funded positions, as futures and repo-financed bonds do |
| DV01 | Change in price for a 1bp move, from the prior close | Hedges are sized on information available before the day's move |
| Yield beta | Regression of 30-year on 10-year daily yield changes, trailing 3 years | Long yields usually move less than 10-year yields |
| Curve factors | Principal components of daily changes in 2-, 5-, 10- and 30-year yields, trailing 3 years | Level, slope and curvature, the textbook decomposition of curve risk |
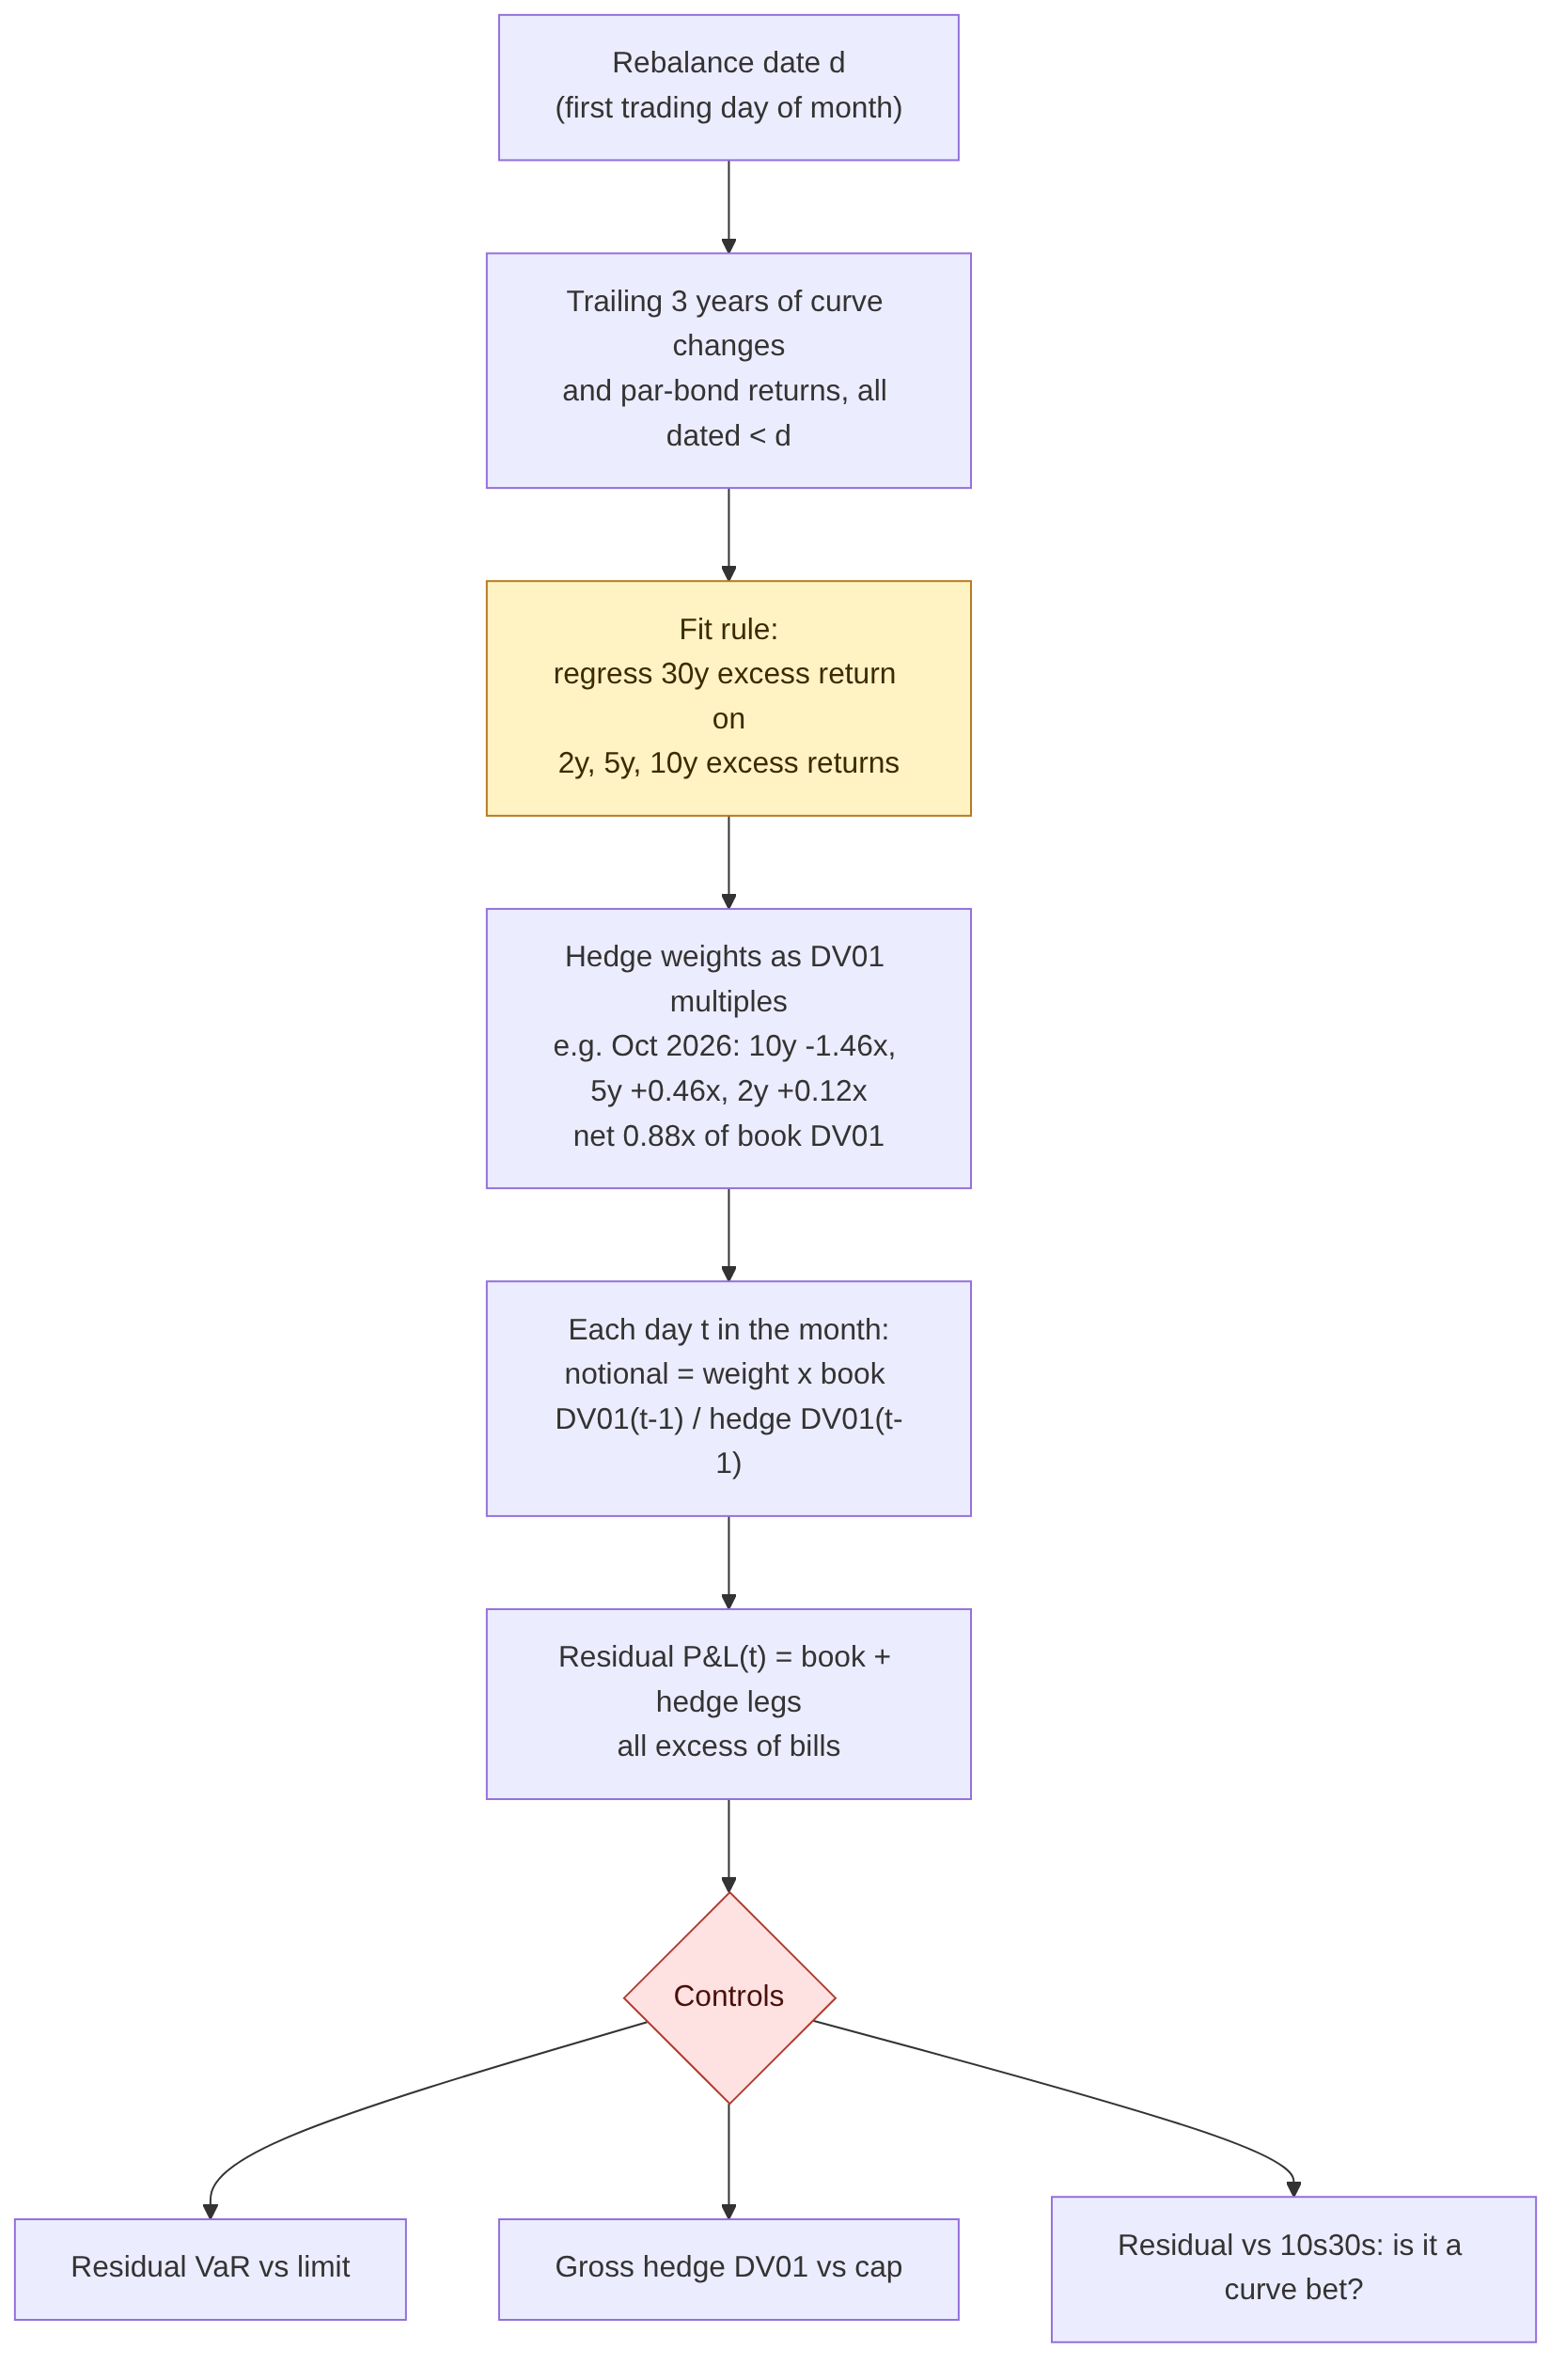
| Regression hedge | 30-year excess return on 2-, 5- and 10-year excess returns, trailing 3 years | Lets the data choose the mix that minimises residual variance |
Training windows end the day before each monthly refit, never reach back more than four years, and require at least 500 days. A unit test shocks the curve after a cut-off date and confirms that no hedge weight set before it changes.
Method
Six rules, all scored the same way on the same days.
- Unhedged. The reference for how much risk there is to remove.
- Duration-matched, 10-year (baseline). Short 10-year DV01 equal to the book's. This is the default on most desks and in most ALM systems.
- Yield-beta, 10-year. The same single instrument, scaled by how much 30-year yields actually move per basis point in the 10-year.
- Two- and three-factor curve hedges. Size the 2- and 10-year (or 2-, 5- and 10-year) so the book has zero exposure to the level and slope (and curvature) factors estimated from the trailing curve.
- Minimum-variance regression. The 2-, 5- and 10-year notionals that minimised the book's residual variance over the trailing three years.
Each rule's residual is measured on the days that followed its refit and never on the data it was fitted to. Confidence intervals resample whole calendar months, so the volatility clustering of rate markets is preserved. As a deliberate leakage benchmark, every rule is also fitted once on the entire test period; the gap between that and the walk-forward result shows how much in-sample fitting flatters each approach.
Results
| Rule (walk-forward, 1994-2026) | Residual risk, $ a year | Variance removed | One-day 99% VaR | Worst day | Fitted with look-ahead |
|---|---|---|---|---|---|
| Unhedged | $150.4M | — | $23.3M | $72.0M | — |
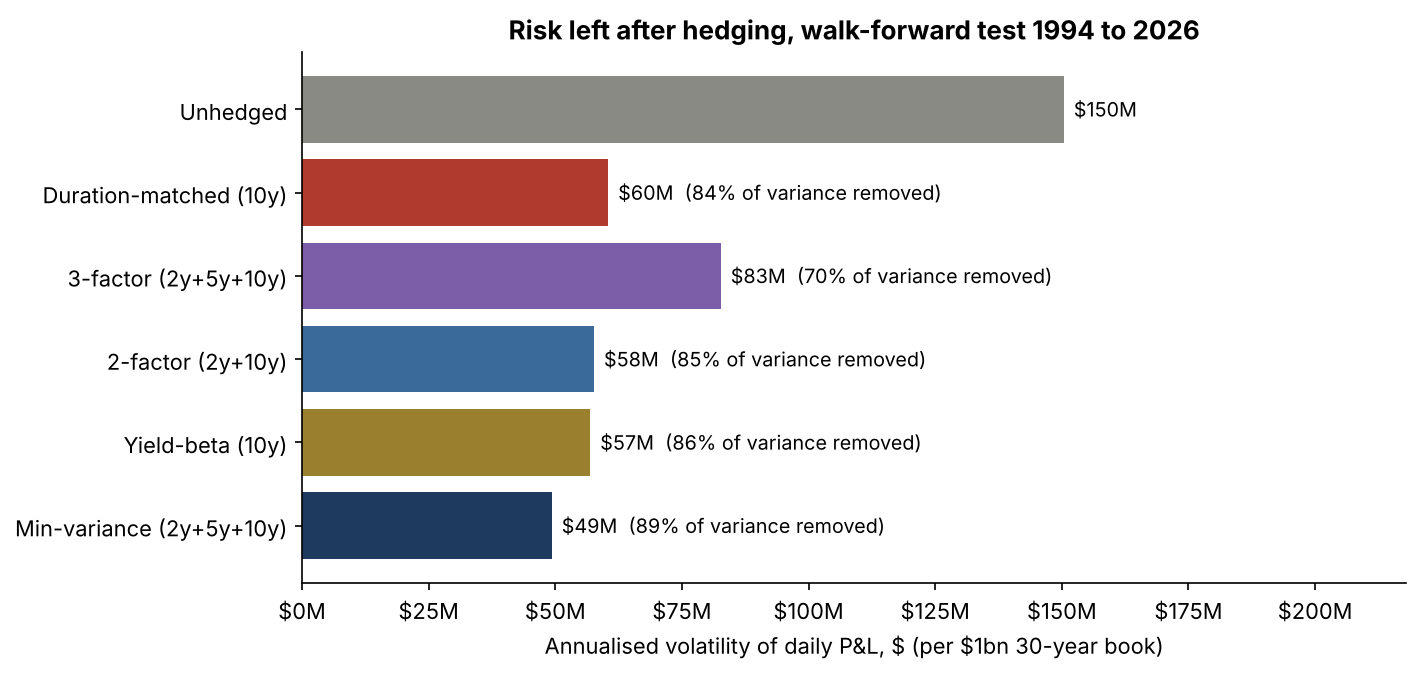
| Duration-matched, 10y (baseline) | $60.4M | 83.9% | $10.5M | $45.2M | 83.9% |
| Yield-beta, 10y | $56.9M | 85.7% | $9.5M | $32.6M | 85.5% |
| Two-factor (2y + 10y) | $57.6M | 85.3% | $9.5M | $48.3M | 87.0% |
| Three-factor (2y + 5y + 10y) | $82.6M | 69.8% | $13.7M | $59.9M | 79.1% |
| Minimum-variance (2y + 5y + 10y) | $49.3M | 89.3% | $8.3M | $40.0M | 89.0% |
Per $1bn of 30-year exposure. Residual-risk ratio to the duration hedge, 95% month-block bootstrap: minimum-variance 0.79 to 0.84; yield-beta 0.92 to 0.97; three-factor 1.25 to 1.51.
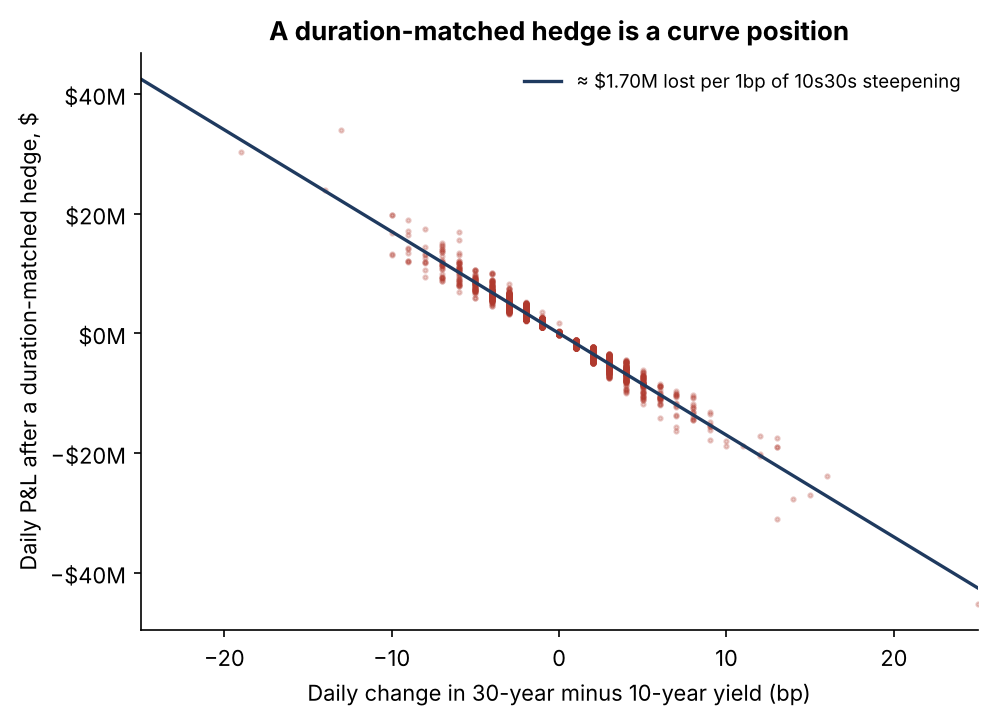
The residual of a duration hedge is a curve position. After the 10-year DV01 hedge, 97% of the remaining daily P&L is explained by the change in the 30-year minus 10-year spread. Every basis point of steepening costs about $1.7M per $1bn. That is not a hedging error to be averaged away; it is a directional curve trade that nobody approved. It made $68M in 2022 as 10s30s flattened from 38bp to 9bp, and lost $31M in March 2023 when the spread steepened 18bp around the SVB failure.
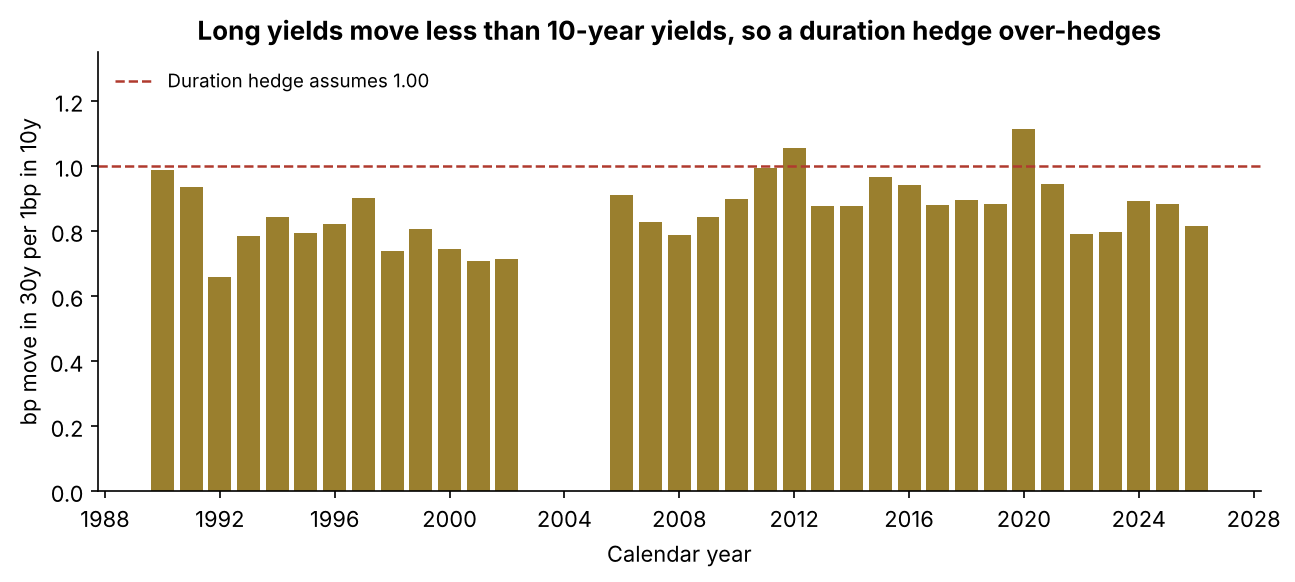
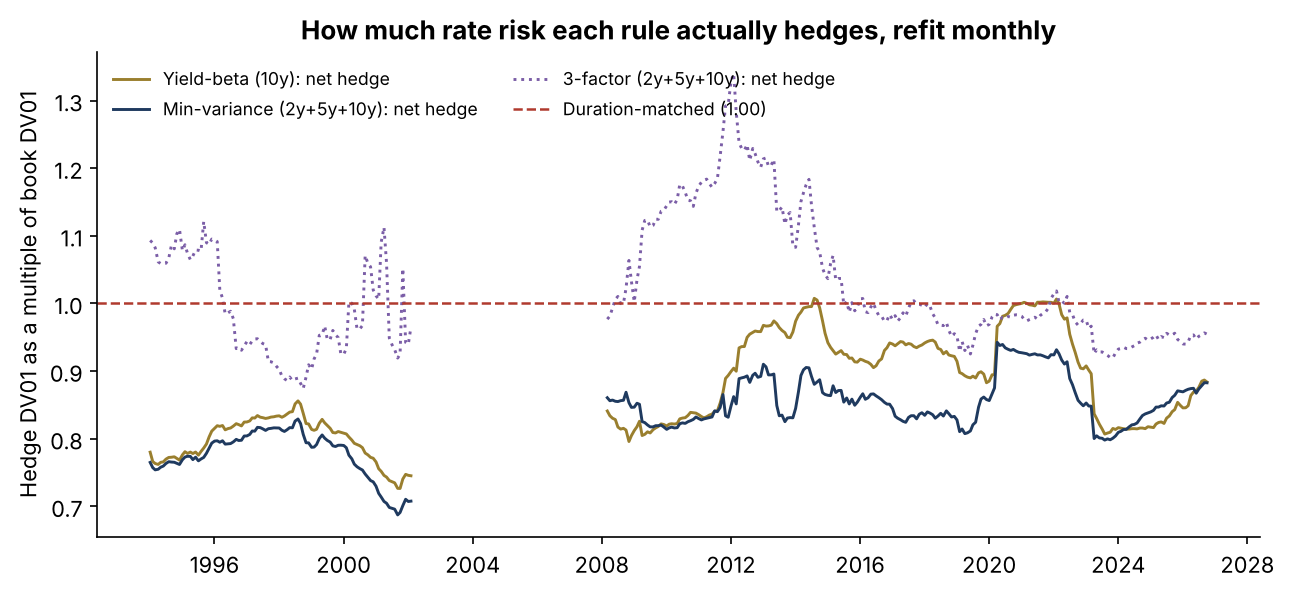
Long yields move less than 10-year yields, so DV01-matching over-hedges. Over the full sample the 30-year moved 0.85bp for every 1bp in the 10-year, with yearly readings from 0.66 in 1992 to 1.12 in 2020. A one-for-one DV01 hedge is short too much 10-year most of the time. The regression hedges carry on average 0.87 and 0.83 times the book's net DV01.
More factors made it worse. The three-factor curve hedge is the textbook answer to curve risk, and out of sample it left 37% more risk than the one-instrument duration hedge. It needed gross hedges of 4.5 times the book's DV01 and cost about 80 times as much to rebalance. Fitted on the whole sample it looks respectable, removing 79% of the variance against 70% walk-forward. The curvature factor is small and unstable, and solving for exact neutrality to it turns estimation noise into large offsetting positions. Only a walk-forward test exposes that.
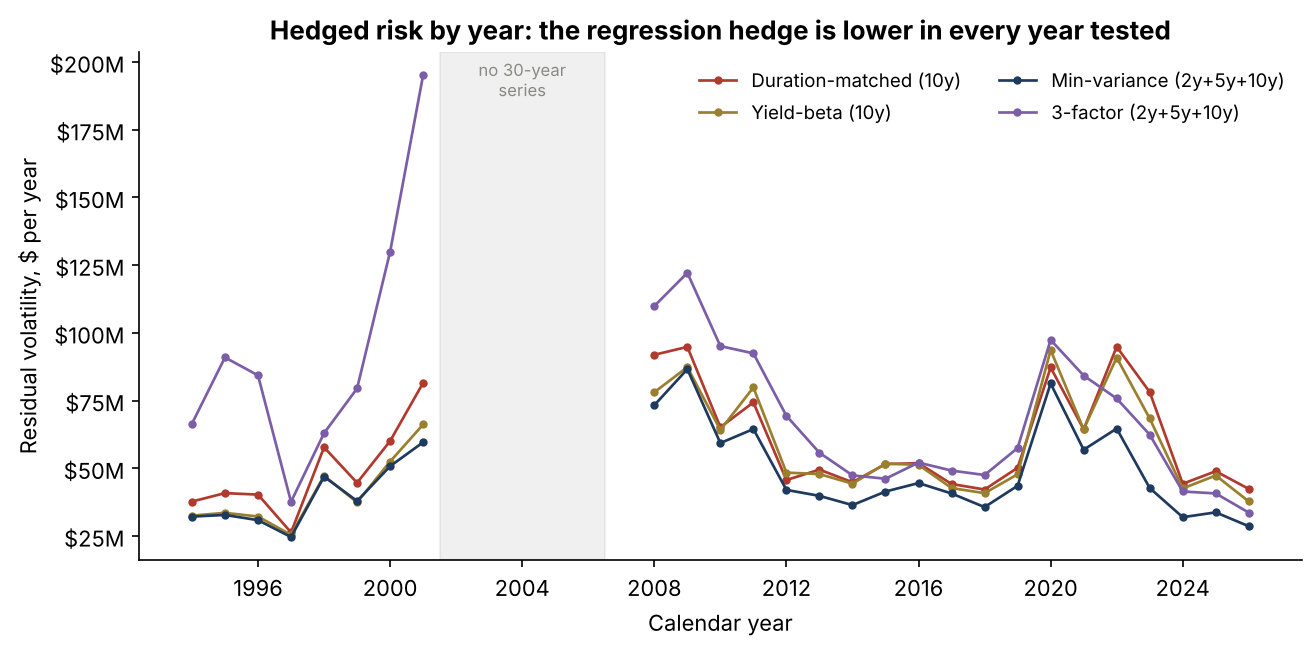
The improvement is stable. On test days before 2010 the minimum-variance hedge left $50.6M against $61.2M for the duration hedge; from 2010 to 2026, $48.4M against $60.0M. It left less risk than the duration hedge in every one of the 28 calendar years tested, and in every stress window.
| Stress window | Duration hedge: worst day | Minimum-variance: worst day | Duration hedge: P&L over window | Minimum-variance: P&L over window |
|---|---|---|---|---|
| Sep-Dec 2008 (Lehman) | $16.2M | $15.0M | +$34.9M | +$84.4M |
| Mar 2020 (dash for cash) | $31.0M | $26.5M | -$17.6M | +$5.6M |
| 2022 (hiking cycle) | $20.1M | $13.9M | +$68.4M | -$12.6M |
| Mar 2023 (SVB) | $27.1M | $7.2M | -$30.7M | -$2.8M |
| Last 12 months | $7.5M | $6.6M | +$45.3M | +$1.7M |
Per $1bn of 30-year exposure. Over the same windows the unhedged book's P&L ranged from +$335M (late 2008) to -$389M (2022). Window P&L includes the carry of the hedged position.
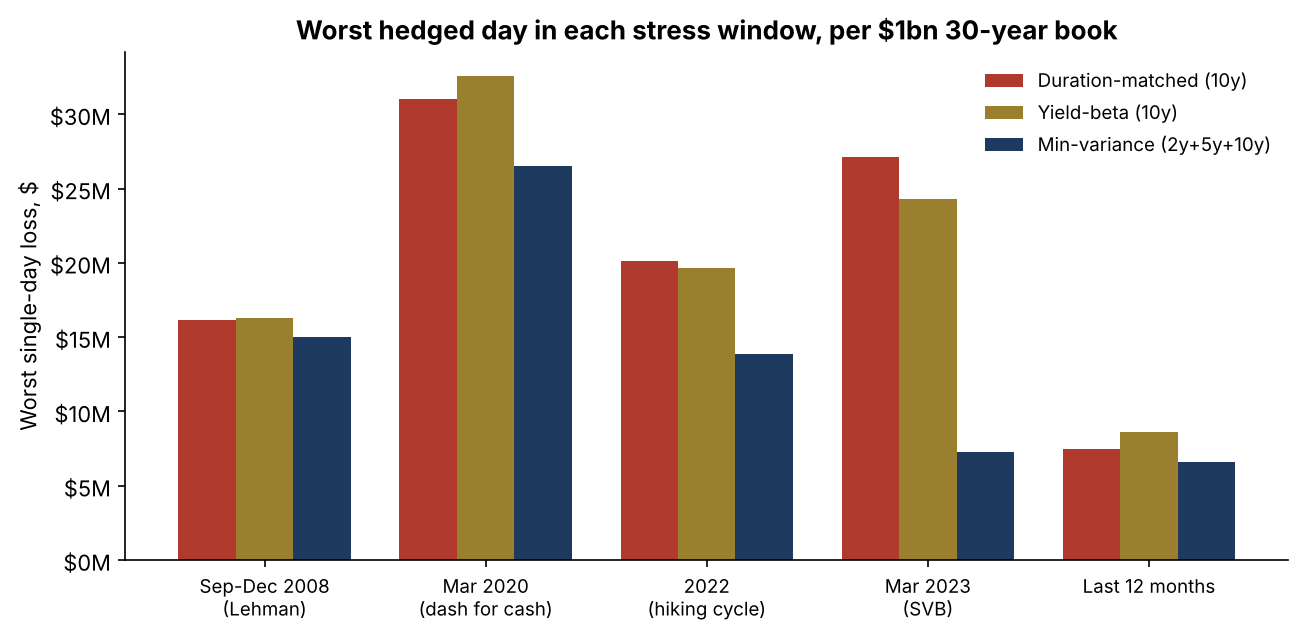
The 2008 row deserves a plain reading. In the late-2008 flight to quality, the minimum-variance hedge made more money than the duration hedge, $84M against $35M, because it was carrying less hedge into a long-end rally. A hedge should be judged on how little it moves, not on whether it made money in one episode; on that test both held up in 2008 and the regression hedge was steadier in every other window.
Recommendations
- Set hedge ratios from a regression on recent data, not one-for-one DV01. A monthly minimum-variance refit on three years of history removed 89% of the variance against 84%, and the gap held in both halves of the sample. As of the October 2026 refit it would hold short 10-year DV01 of 1.46 times the book, partly offset by long 5-year (0.46 times) and 2-year (0.12 times): net 0.88 times.
- Keep the duration hedge as the reference and fall back to it automatically. Report realised residual risk for both every month; revert if the regression hedge loses two consecutive quarters.
- Limit residual curve exposure explicitly. Report the 10s30s sensitivity of the hedged book alongside DV01 and put a limit on it. A DV01-flat book can carry $1.7M per basis point per $1bn of curve risk.
- Cap gross hedge DV01. Twice the book's DV01 is a reasonable ceiling. The three-factor hedge breached it on average and that was the warning sign.
- Do not approve a hedge rule on an in-sample fit. The three-factor rule gained 9 points of variance reduction from look-ahead. Walk-forward evidence should be the standard for any hedge methodology change.
- Re-test before applying to non-Treasury books. Corporate, mortgage and liability books carry spread and convexity risk this test does not cover.
Limits
The positions are constant-maturity par bonds built from the official curve, not specific bonds or futures contracts, so cheapest-to-deliver switches, futures basis, repo specialness and bond-level bid-ask are not modelled. Rebalancing costs and capital charges are illustrative assumptions, labelled as such. VaR is historical and measured on a single position, without portfolio diversification or liquidity horizons beyond ten days. The 30-year series was suspended from 2002 to 2006, so the test pauses for that period and restarts once two years of fresh history exist. This is independent research on public data; it has not been deployed and is not investment advice.
Sources
Data
- US Department of the Treasury, Daily Treasury Par Yield Curve Rates. home.treasury.gov. Copy used: huggingface.co/datasets/defeatbeta/yahoo-finance-data, revision f9120ae, file data/US/daily_treasury_yield.parquet.
Methods referenced
- Litterman, R. and Scheinkman, J. (1991). "Common Factors Affecting Bond Returns." Journal of Fixed Income, 1(1), 54-61.
- Tuckman, B. and Serrat, A. (2022). Fixed Income Securities: Tools for Today's Markets, 4th ed. Wiley. Chapters on DV01, regression and factor hedging.
- Basel Committee on Banking Supervision (2019). Interest rate risk in the banking book (IRRBB) and Minimum capital requirements for market risk.
Independent research on public data, not investment advice; capital, cost-of-capital and transaction-cost figures are illustrative. Analysis, code, charts and text were produced with AI assistance and reviewed by the author.