Digital-asset collateral is moving into the regulated balance sheet. Spot ETFs keep drawing money, listed companies are funding bitcoin and ether treasuries with preferred stock and converts, US bank supervisors have opened the door to custody and lending, and prime brokers that started in crypto are now broker-dealers. Every one of those businesses has to answer the same credit question before it lends: how much can we advance per dollar of crypto collateral, and what do we lose if the client fails in the next crash?
That number is the haircut. Set it too high and the desk lends less than competitors and earns less; set it too low and the lender owns the gap between the loan and the collateral on the worst two days of the cycle. This note tests four haircut rules walk-forward on eight years of daily reference prices for 17 coins, through COVID, the 2022 lender failures, FTX and the October 2025 liquidation cascade. The result changes what I would ask a credit committee to approve and how I would ask them to judge it.
Executive summary
The question. Which haircut rule should a lender apply to crypto collateral, and how should a credit committee judge it?
The approach. Four rules set a haircut every day for 17 coins, using only prices up to that day, at 99% confidence over a two-day close-out: a static grid of the kind desks start with, a one-year historical VaR (the baseline), a volatility-scaled rule (filtered historical simulation), and the same rule with a floor based on up to ten years of each coin's history. Each haircut is scored against the loss over the two days that followed. The test runs from January 2018 to May 2026: 44,497 coin-days. An illustrative $1bn cross-margined book (half bitcoin, a quarter ether, a quarter spread across the rest) translates the results into lending, revenue and loss.
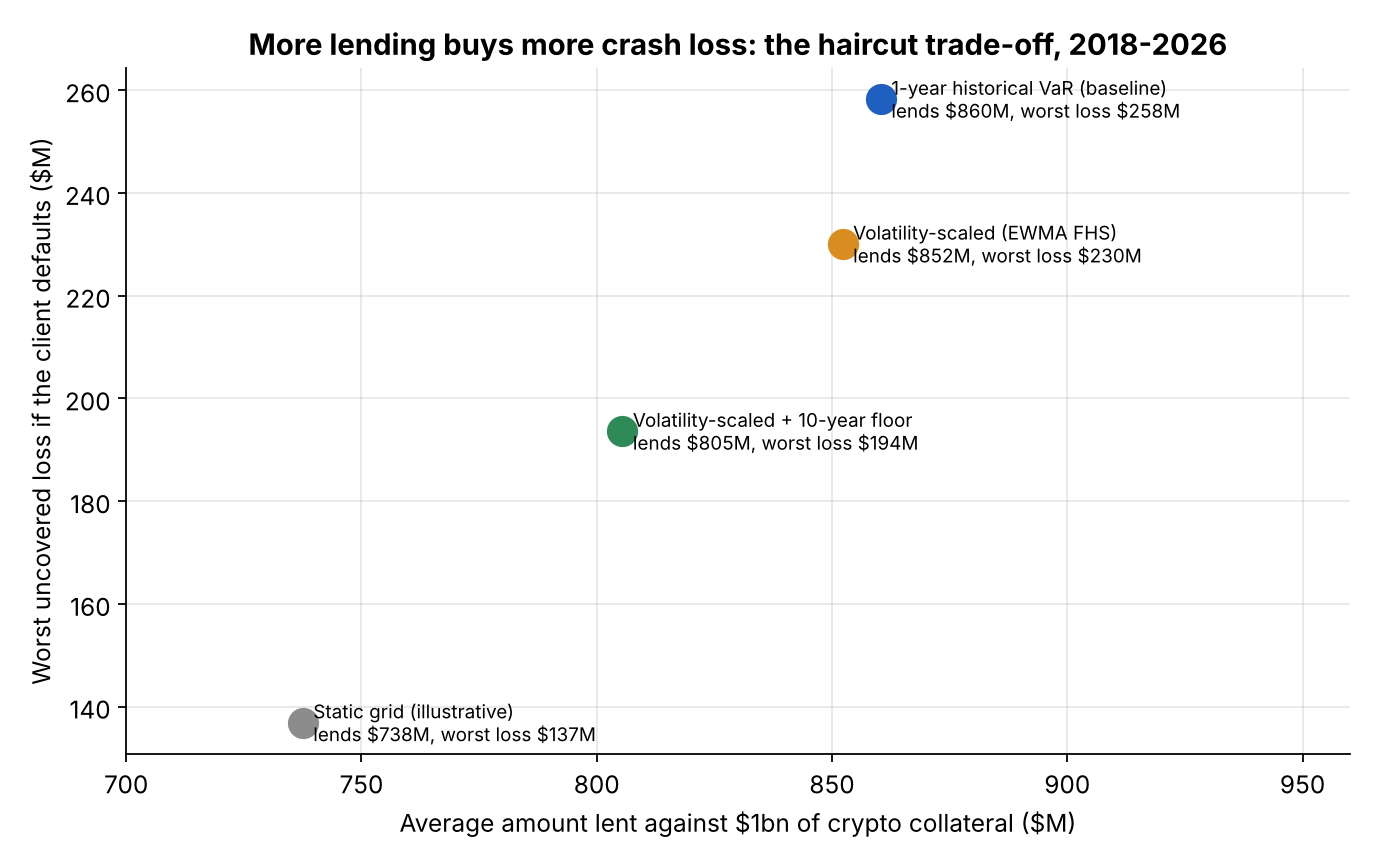
The answer. The one-year VaR is the rule most validation frameworks would approve: it breached 1.18% of the time against a 1% target and passes the standard Kupiec test. It also left $300.9M uncovered across the six crash dates, failing in five of them, because its breaches are rare but large. The volatility-scaled rule lends the same and fails the same way, and it adds a second problem: margin calls of up to $288.5M in five days, demanded in the middle of the crash. The ten-year floor cut crash losses to $164.7M and failed in two of six crashes, for $54.9M less lending per $1bn. The static grid lost only $25.8M across the crashes but lent $122.9M less than the baseline.
The decision it supports. Replace the one-year VaR with the volatility-scaled haircut and a long-memory floor, judge haircut rules on their loss in named crashes rather than on breach frequency, and put a book-level limit on stress loss at a 40% two-day move, because no rule tested covered March 2020.
Business outcomes
| Business lever | 1-year VaR (baseline) | Volatility-scaled + 10-year floor | Static grid | What it means |
|---|---|---|---|---|
| Average lent per $1bn of collateral | $860M | $805M | $738M | The floor gives up 6% of lending capacity; the grid gives up 14% |
| Spread revenue at 4% (illustrative) | $34.4M a year | $32.2M a year | $29.5M a year | $2.2M a year is the price of the floor |
| Uncovered loss if the client fails at each of six crash dates | $300.9M | $164.7M | $25.8M | Loss lands exactly when other clients are also failing |
| Crashes in which the haircut was too small | 5 of 6 | 2 of 6 | 1 of 6 | Breach frequency on ordinary days does not predict this |
| Worst single uncovered loss (10 March 2020) | $258.3M | $193.6M | $136.9M | No rule covered a 39.9% two-day fall on the book |
| Peak 5-day increase in margin demanded | $18.0M | $241.8M | $0 | Responsive rules call for collateral when it is scarcest |
| Break-even versus the baseline | — | Client failure in 13.5% of crashes | Client failure in 15.0% of crashes | Above that rate the safer rule earns its cost |
Illustrative $1bn cross-margined book: 50% BTC, 25% ETH, 25% split equally across the other lendable coins each day. Haircuts at 99% confidence over a two-day margin period of risk; walk-forward, January 2018 to May 2026 (8.4 years). Crash dates fixed before results were run: 11 Mar 2020, 18 May 2021, 12 Jun 2022, 7 Nov 2022, 3 Aug 2024, 9 Oct 2025. Spread revenue assumes a 4% annual net lending spread on the amount advanced. Break-even = spread given up over the test ($18.4M for the floor, $41.2M for the grid) divided by crash loss avoided ($136.2M and $275.1M).
End to end in six steps
| Step | What happens | Output |
|---|---|---|
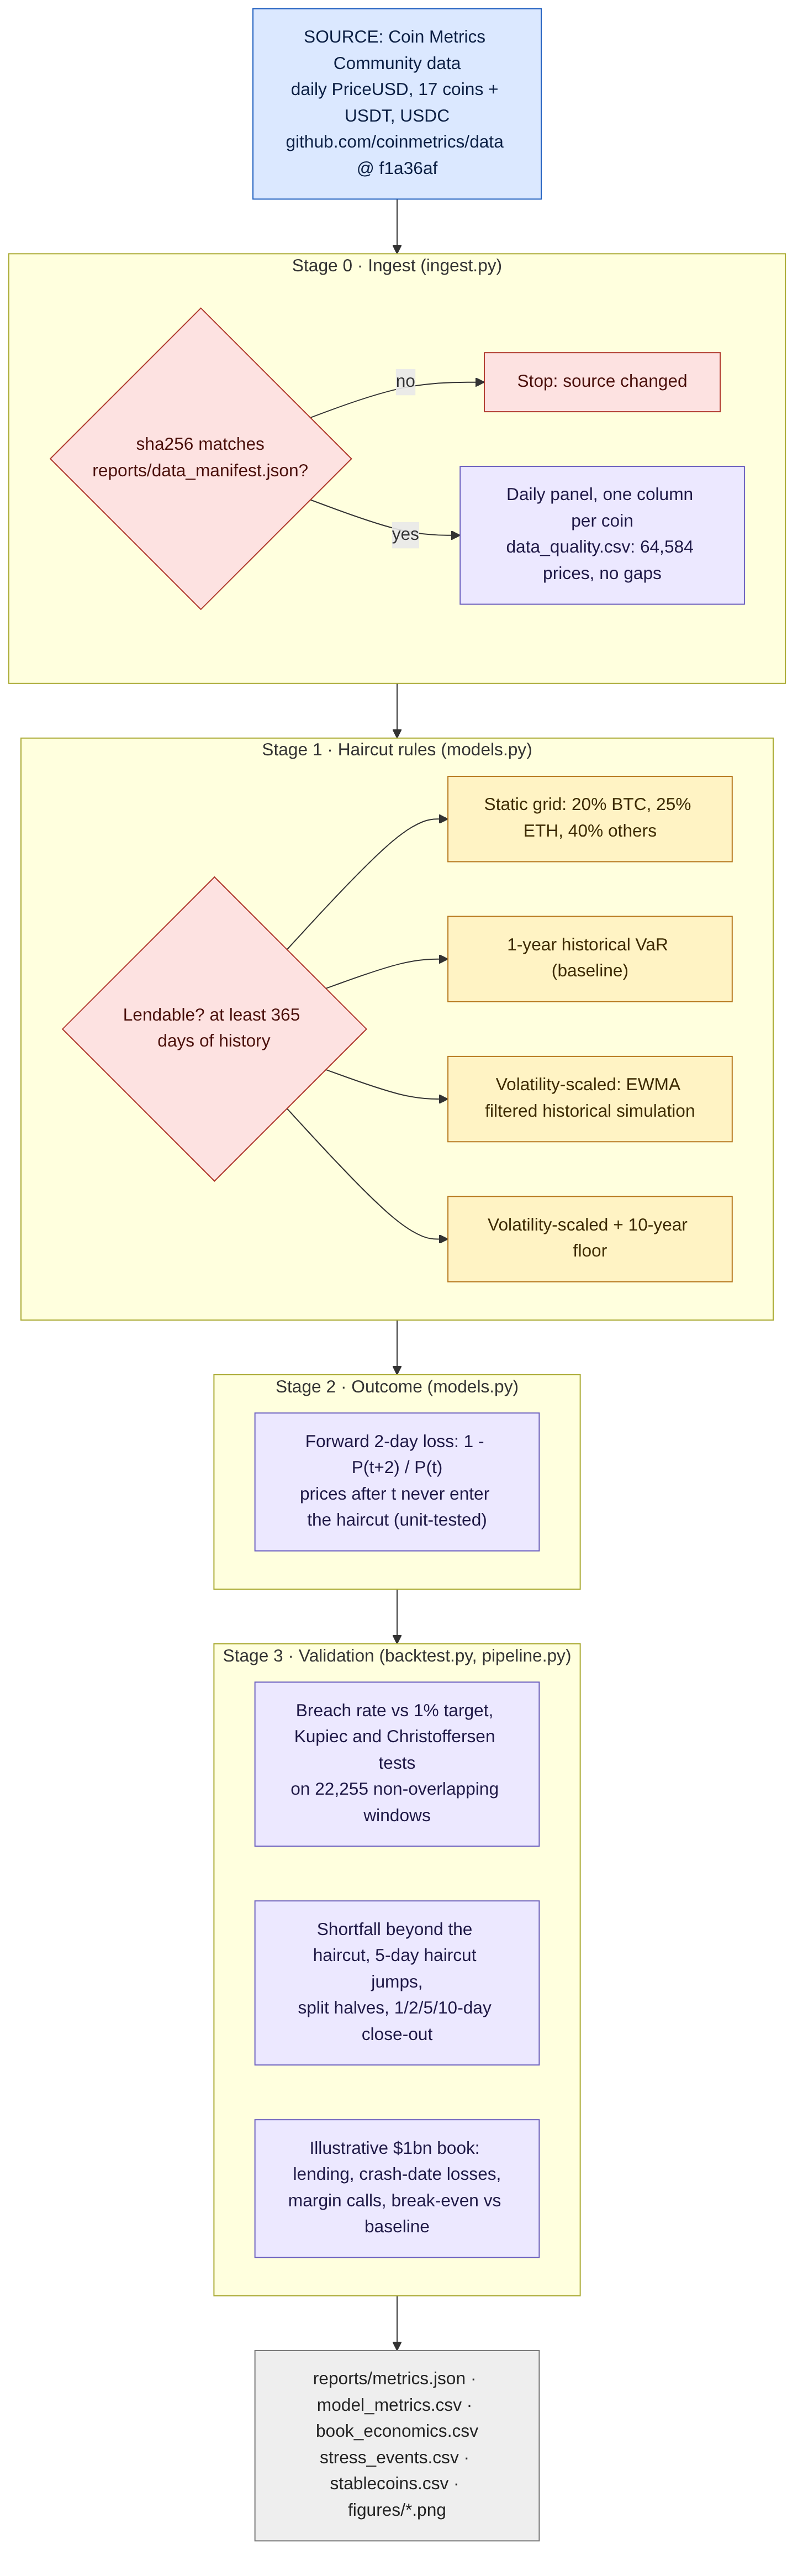
| 1. Source | Download Coin Metrics daily reference prices for 17 coins and two stablecoins from a pinned commit; record sha256 for every file | 64,584 daily prices, no gaps |
| 2. Lendability | A coin becomes eligible collateral after 365 days of price history | 44,497 coin-days in the test |
| 3. Haircut rules | Static grid, 1-year historical VaR, volatility-scaled (EWMA filtered historical simulation), volatility-scaled with a 10-year floor | A haircut per coin per day from prices up to that day |
| 4. Outcome | Loss over the two days after each margin date, as if a defaulted client's collateral were sold then | Breach or not, and the uncovered loss beyond the haircut |
| 5. Validation | Kupiec and Christoffersen tests on 22,255 non-overlapping windows, split halves, 1- to 10-day close-out, stablecoins | Model metrics and stress-event table |
| 6. Decide | Illustrative $1bn book: lending, revenue, crash losses, margin calls, break-even | Haircut rule, limits and controls |
The data
The source is Coin Metrics' free Community data archive, which publishes a daily end-of-day USD reference price for each asset, built from trades across many exchanges rather than a single venue. That matters for collateral: a lender marks to a reference price, not to the last print on one exchange. The archive is pinned to a specific commit and every file is checksummed, so each number here can be reproduced byte for byte. Coin Metrics licenses the data under CC BY-NC 4.0; it is not redistributed in the repository.
The collateral universe is every coin in the free archive with a continuous daily history starting before 2021: bitcoin, ether, XRP, BNB, dogecoin, cardano, tron, chainlink, litecoin, bitcoin cash, stellar, ethereum classic, algorand, polkadot, uniswap, aave and polygon's MATIC. MATIC's series ends in October 2025 and is kept until then, so a coin that faded does not drop out of the history. Tether and USD Coin are tested separately. The latest price in the pinned archive is 23 May 2026.
How the haircuts are built
| Element | How it is built | Why it matters |
|---|---|---|
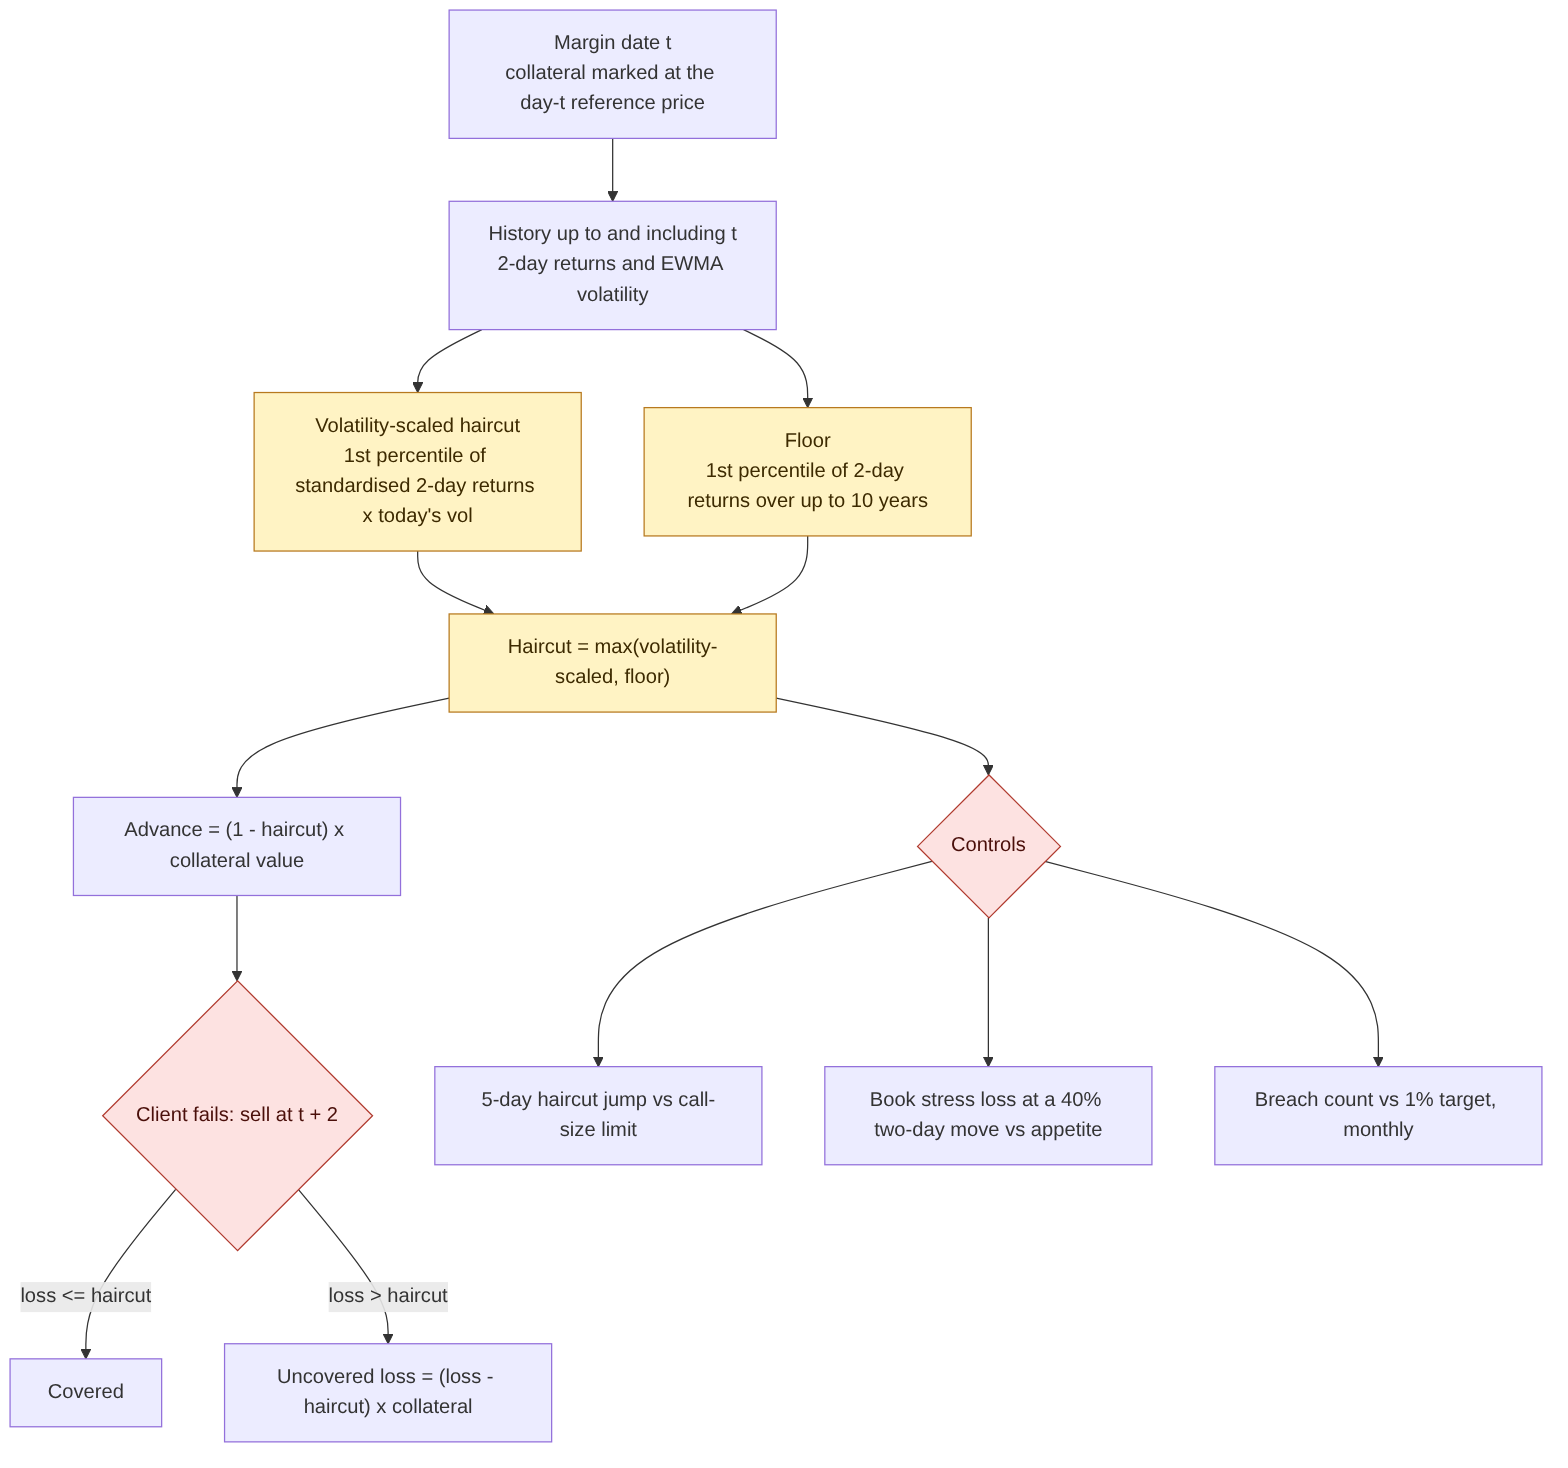
| Two-day return | Log change in the reference price over two days | The margin period of risk: time from the last good margin to selling a defaulted client's collateral |
| Static grid | 20% BTC, 25% ETH, 40% for every other coin (illustrative) | How many desks start; no data needed, no reaction to markets |
| One-year historical VaR | 1st percentile of two-day returns over the trailing 365 days | The most common first model; meets a 1% target if the next year looks like the last |
| EWMA volatility | Exponentially weighted daily volatility, decay 0.94 | Weights recent days more, so the haircut reacts to a change in regime |
| Volatility-scaled haircut | Three years of two-day returns divided by the volatility at the time, 1st percentile, multiplied by today's volatility | Filtered historical simulation: the shape of past tails at today's level of volatility |
| Ten-year floor | 1st percentile of two-day returns over up to ten years of the coin's own history | Long memory: the haircut cannot fall below what the coin's worst periods required |
All rules target 99% confidence. Haircuts on day t use prices up to and including day t. A unit test rewrites prices after a cut-off date and confirms that no haircut set before it changes. Haircuts are capped at 100%.
Method
Four rules, scored the same way on the same coin-days.
- Static grid (illustrative). Fixed haircuts by tier. It needs no model and never changes.
- One-year historical VaR (baseline). The haircut equals the loss exceeded on only 1% of two-day windows over the past year.
- Volatility-scaled. Filtered historical simulation: past two-day moves are rescaled by how volatile the market was at the time and then by how volatile it is today.
- Volatility-scaled with a ten-year floor. The same, but never below the one-in-a-hundred two-day loss over up to ten years of the coin's history. This is the long-lookback option that European clearing rules offer as a protection against margins that collapse in calm markets and spike in stress.
Each haircut is compared with the loss over the following two days. A breach is a loss larger than the haircut; the uncovered loss is the excess. Frequency is tested with the Kupiec proportion-of-failures test, and clustering with Christoffersen's independence test, both on non-overlapping windows. Two things are measured that standard backtests ignore: the size of the loss in six crashes named in advance, and the margin calls each rule itself creates, measured as the five-day increase in haircut on the book.
Results
| Rule (walk-forward, 2018-2026) | Average haircut | Breach rate (target 1%) | Kupiec p-value | Worst single-coin uncovered loss | Largest 5-day haircut increase |
|---|---|---|---|---|---|
| Static grid (illustrative) | 37.6% | 0.04% | 0.00 (far too few) | 20.1% | 0 |
| 1-year historical VaR (baseline) | 16.4% | 1.18% | 0.07 (passes) | 34.0% | 6.5 points |
| Volatility-scaled | 16.5% | 1.15% | 0.09 (passes) | 34.1% | 44.1 points |
| Volatility-scaled + 10-year floor | 21.8% | 0.30% | 0.00 (too few) | 28.8% | 44.1 points |
44,497 coin-days; Kupiec and Christoffersen tests on 22,255 non-overlapping two-day windows. Breaches of the volatility-scaled rule cluster (independence p = 0.018); the other rules' do not. Average haircut for bitcoin: 20.0%, 11.5%, 12.9% and 17.2% respectively; for ether 25.0%, 15.3%, 15.9% and 20.8%.
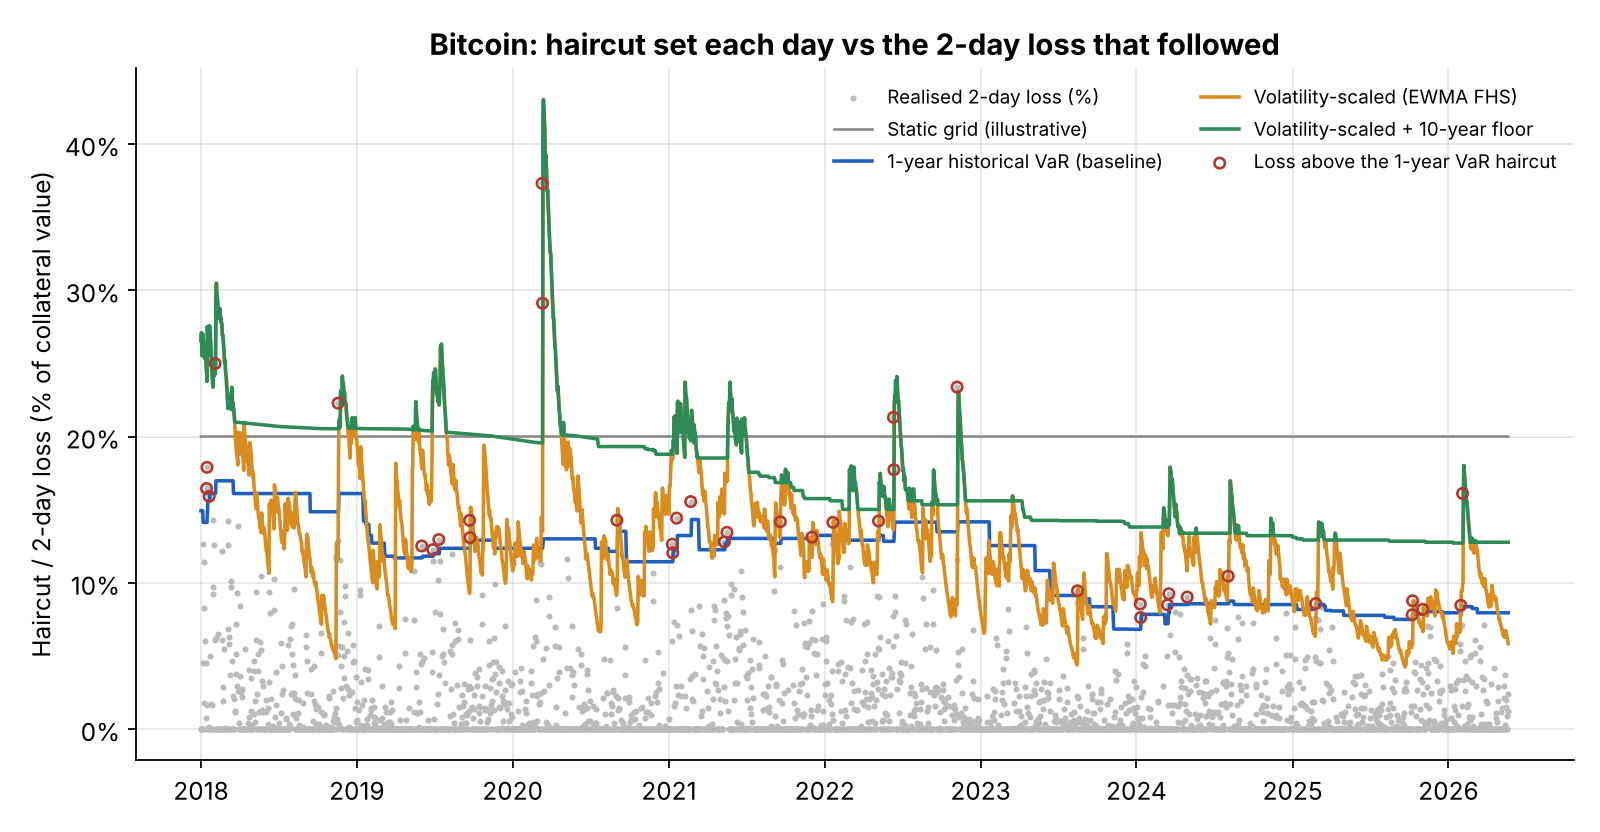
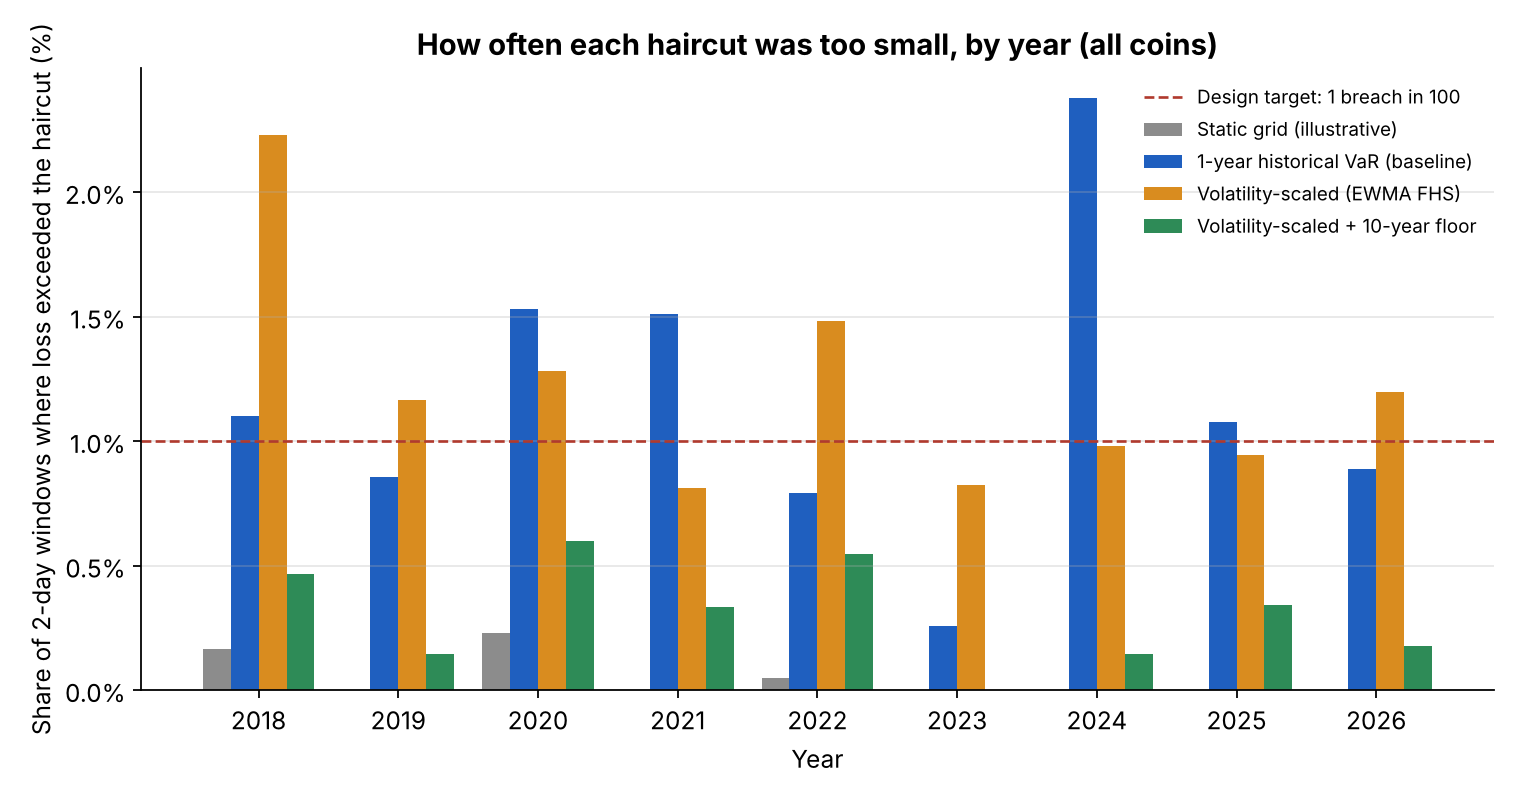
Passing the backtest is not the same as protecting the lender. By the standard a model validator applies, the one-year VaR is the right rule: its breach rate is close to target and statistically indistinguishable from it. The floor rule fails that same test in the other direction, breaching too rarely. But the lender's loss does not come from how often the haircut is exceeded. It comes from how far, and on which days. The one-year VaR held 15.2% on the eve of the FTX collapse, when the book went on to lose 26.2% in two days.
Every rule that learns from recent markets is thinnest just before the crash. Calm periods compress volatility, and haircuts fitted to calm periods shrink. Going into FTX the volatility-scaled haircut on the book had fallen to 11.2%; going into the October 2025 cascade it was 8.6% against a 12.6% loss. The one-year VaR had the same problem more slowly. The floor carries the memory of earlier crashes forward and held 18.0% and 15.3% on those two dates.
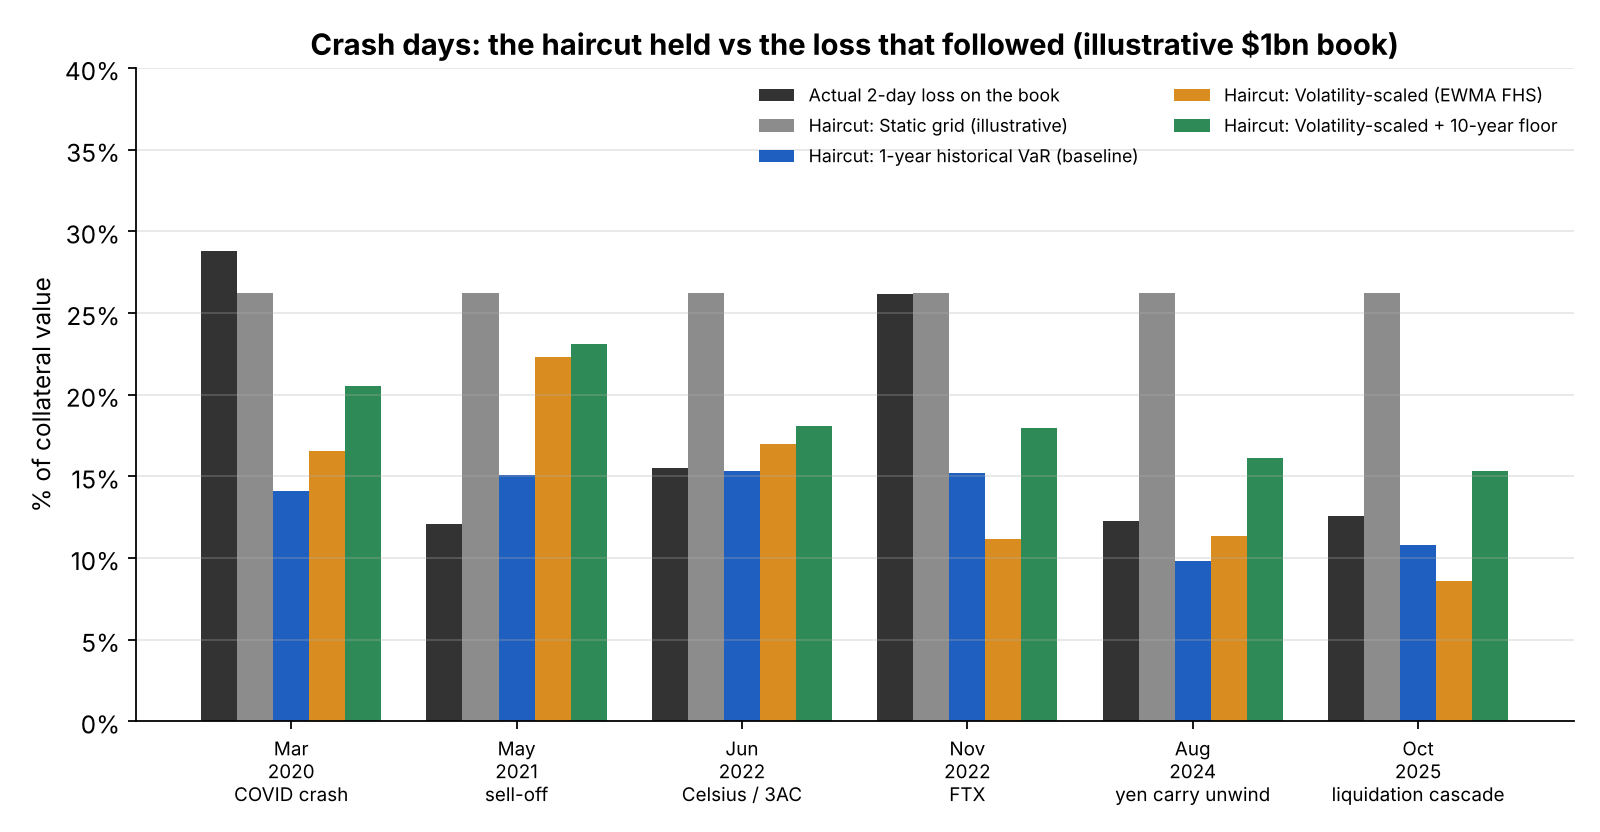
| Crash date | Two-day loss on the book | 1-year VaR uncovered | Volatility-scaled uncovered | Floor uncovered | Grid uncovered | Worst coin |
|---|---|---|---|---|---|---|
| 11 Mar 2020 (COVID) | 28.8% | $147.2M | $122.7M | $82.9M | $25.8M | LINK -35.8% |
| 18 May 2021 | 12.1% | $0 | $0 | $0 | $0 | LINK -27.9% |
| 12 Jun 2022 (Celsius, 3AC) | 15.5% | $1.9M | $0 | $0 | $0 | TRX -27.4% |
| 7 Nov 2022 (FTX) | 26.2% | $109.5M | $149.5M | $81.7M | $0 | ALGO -36.8% |
| 3 Aug 2024 (yen carry unwind) | 12.3% | $24.3M | $9.4M | $0 | $0 | UNI -18.7% |
| 9 Oct 2025 (liquidation cascade) | 12.6% | $18.0M | $40.1M | $0 | $0 | DOT -26.3% |
Per $1bn of collateral, cross-margined. The single worst two-day window for every rule was 10 to 12 March 2020, when the book lost 39.9%.
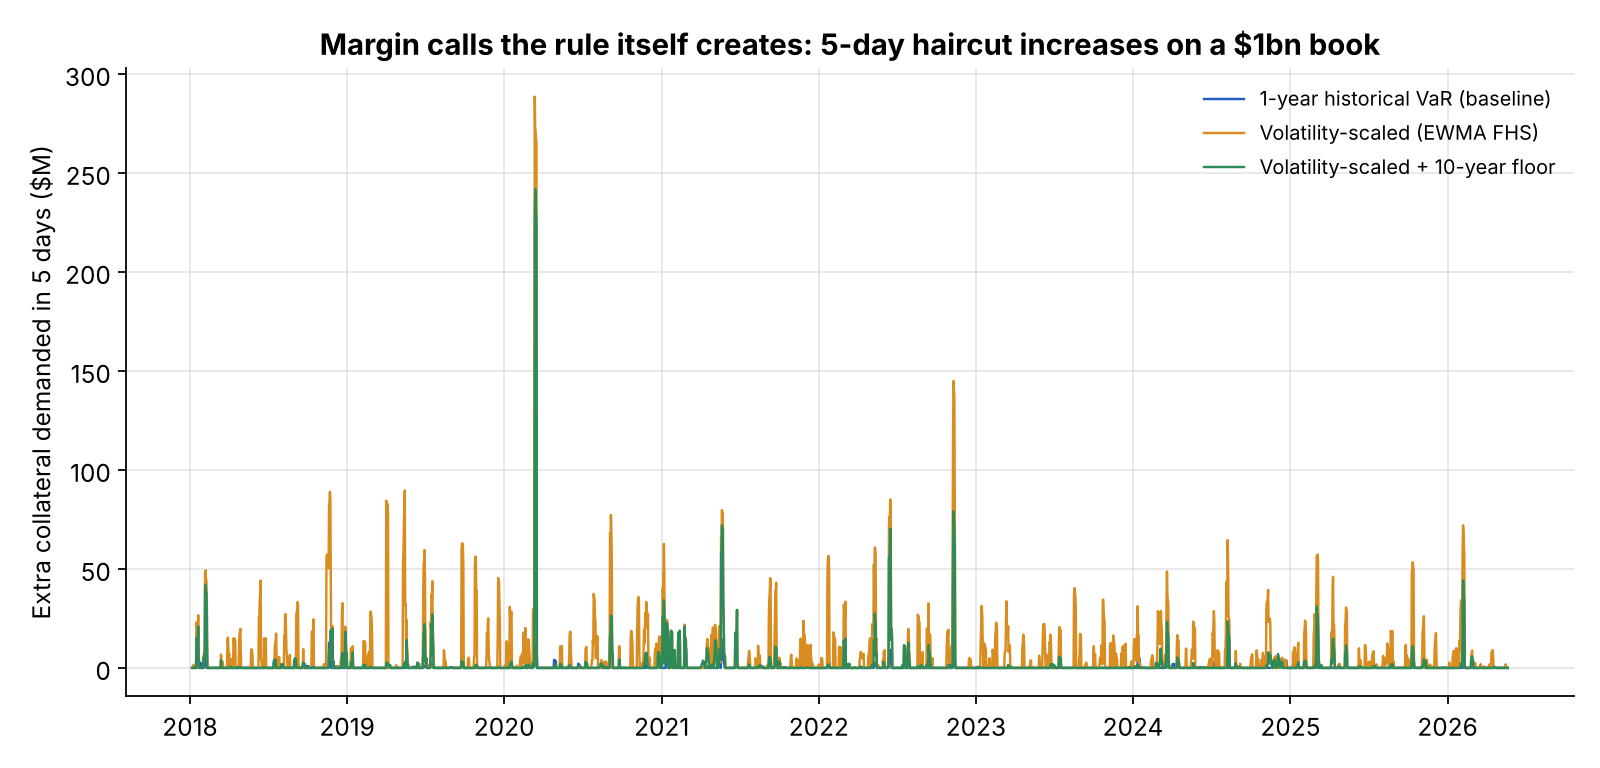
Responsive haircuts create their own margin calls. A haircut that jumps when volatility jumps is doing its job, but the cash has to come from somewhere. The volatility-scaled rule would have asked for up to $288.5M of extra collateral in five days on a $1bn book in March 2020, and the floor rule $241.8M, because the floor only binds in calm markets. The one-year VaR never asked for more than $18.0M; it was slow, which is why it was short in the crash. A committee has to choose explicitly between a haircut that is late and one that calls for cash when clients have least of it.
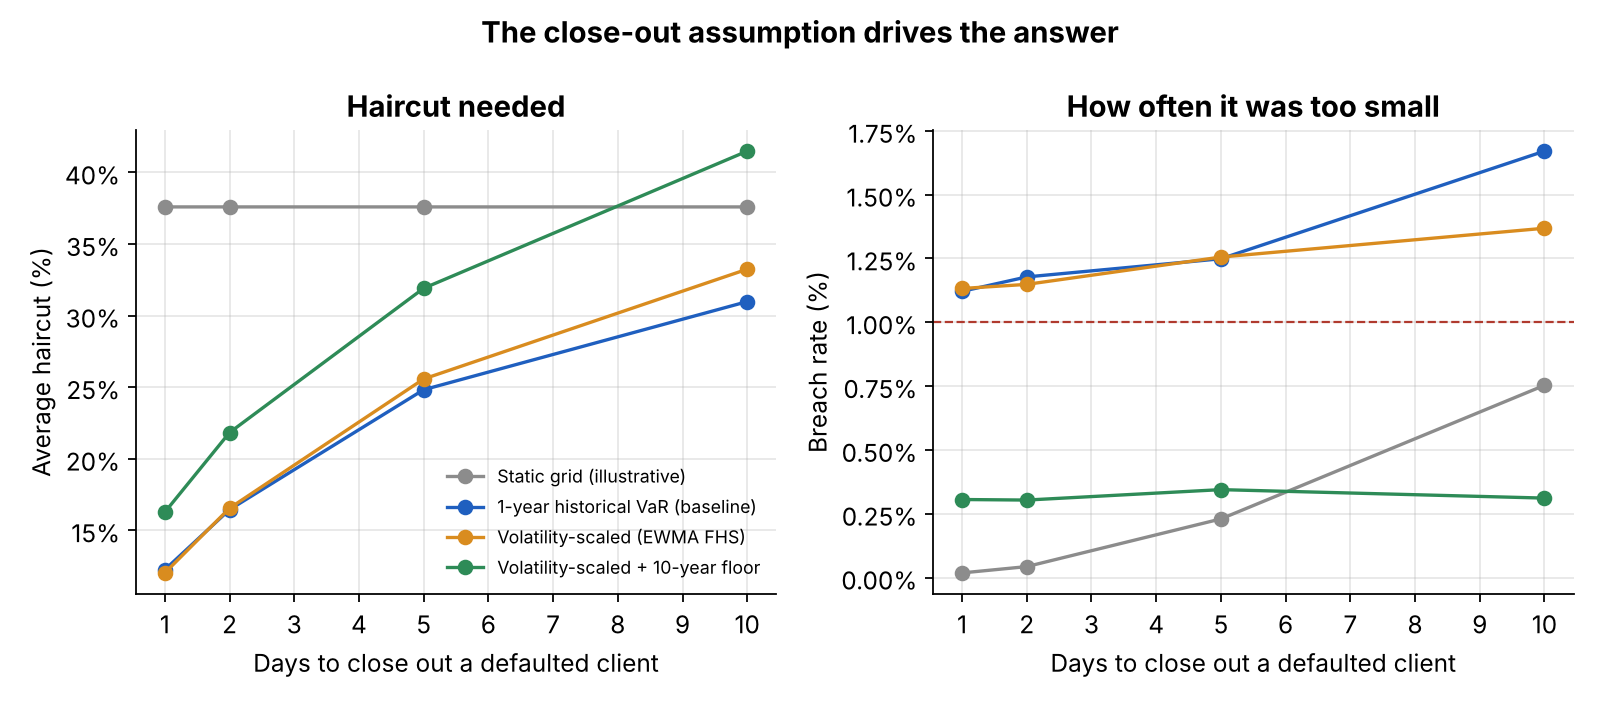
The ranking holds in both halves and across close-out assumptions. From 2018 to 2021 the baseline breached 1.29% and the floor 0.38%; from 2022 to 2026, 1.11% and 0.25%. Lengthening the close-out from two to five days raises the floor's average haircut from 21.8% to 31.9% and the baseline's breach rate from 1.18% to 1.25%; at ten days, 1.67%. The haircut is only as good as the assumption about how fast collateral can be sold, and in a cascade that assumption is the first to fail.
Stablecoins are collateral, not cash. USD Coin's one-year VaR haircut on 9 March 2023 was 0.08%. Over the next two days, as its reserve bank failed, it lost 2.9% against the dollar, 36 times the haircut. Tether's worst two-day loss in the test was 3.4%, in April 2019. A lender that treats stablecoins as cash equivalents is taking issuer and reserve risk at a zero haircut.
Recommendations
- Replace the one-year VaR with a volatility-scaled haircut and a ten-year floor. On this evidence it gives up about $55M of lending per $1bn and cuts uncovered crash loss from $301M to $165M. At an illustrative 4% spread, it pays for itself if a client fails in more than about one crash in seven.
- Change the approval standard. Judge haircut rules on uncovered loss in a fixed set of named crash scenarios, alongside breach frequency. A breach rate near 1% is necessary, not sufficient.
- Set a book-level stress limit. No rule tested covered 10 to 12 March 2020. Limit uncovered loss at a 40% two-day move on the whole book, reported daily next to the haircuts.
- Phase margin increases, inside a hard limit. Spread haircut increases over three days unless the stress limit is breached. This trades a little exposure for fewer forced liquidations of solvent clients.
- Keep tier minimums for thin coins and stablecoins. Add concentration charges against daily volume, and a minimum haircut on stablecoins that reflects issuer and reserve risk.
- Review monthly, with a challenger. Run the one-year VaR and the static grid alongside the champion; escalate to the committee if crash-scenario loss or call sizes exceed limits.
Limits
The prices are daily end-of-day reference rates, not intraday lows, so the losses here are what a lender would see if it could sell at the next two closes. In a liquidation cascade, slippage and exchange outages make actual losses larger. Positions are single coins and a simple cross-margined basket; client-level portfolio margining, concentration in a client's own token, custody and exchange failure, and correlation between client default and market moves are not modelled beyond the crash-date scenarios. The static grid levels and the lending spread are illustrative assumptions, labelled as such. The data archive ends on 23 May 2026. This is independent research on public data; it has not been deployed and is not investment or lending advice.
Sources
Data
- Coin Metrics, Community Data (daily PriceUSD reference rates), CC BY-NC 4.0. github.com/coinmetrics/data. Copy used: commit f1a36af, files csv/[asset].csv, downloaded 22 October 2026.
Methods referenced
- J.P. Morgan/Reuters (1996). RiskMetrics — Technical Document, 4th ed. (EWMA volatility.)
- Barone-Adesi, G., Giannopoulos, K. and Vosper, L. (1999). "VaR without correlations for portfolios of derivative securities." Journal of Futures Markets, 19(5), 583-602. (Filtered historical simulation.)
- Kupiec, P. (1995). "Techniques for verifying the accuracy of risk measurement models." Journal of Derivatives, 3(2), 73-84.
- Christoffersen, P. (1998). "Evaluating interval forecasts." International Economic Review, 39(4), 841-862.
- Commission Delegated Regulation (EU) No 153/2013, Article 28: anti-procyclicality margin measures for central counterparties.
Independent research on public data, not investment or lending advice; lending-spread, static-grid and book figures are illustrative. Analysis, code, charts and text were produced with AI assistance and reviewed by the author.