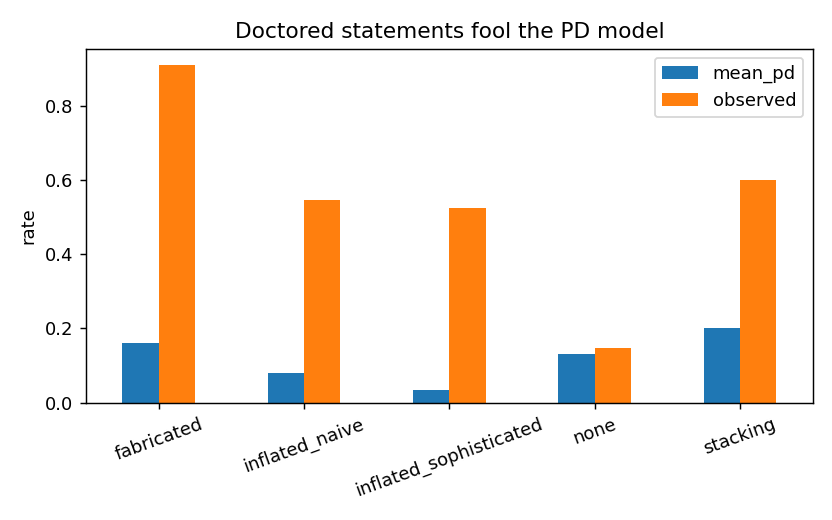
A credit model trained on bank statements will happily approve a business whose statements were edited to look healthy. In the pipeline described here, applicants with sophisticated doctored statements received an average predicted default probability of 3.5%. More than half of them defaulted.
That single result shapes the whole architecture. Fraud cannot be one more input to the credit model. It has to be a gate in front of it.
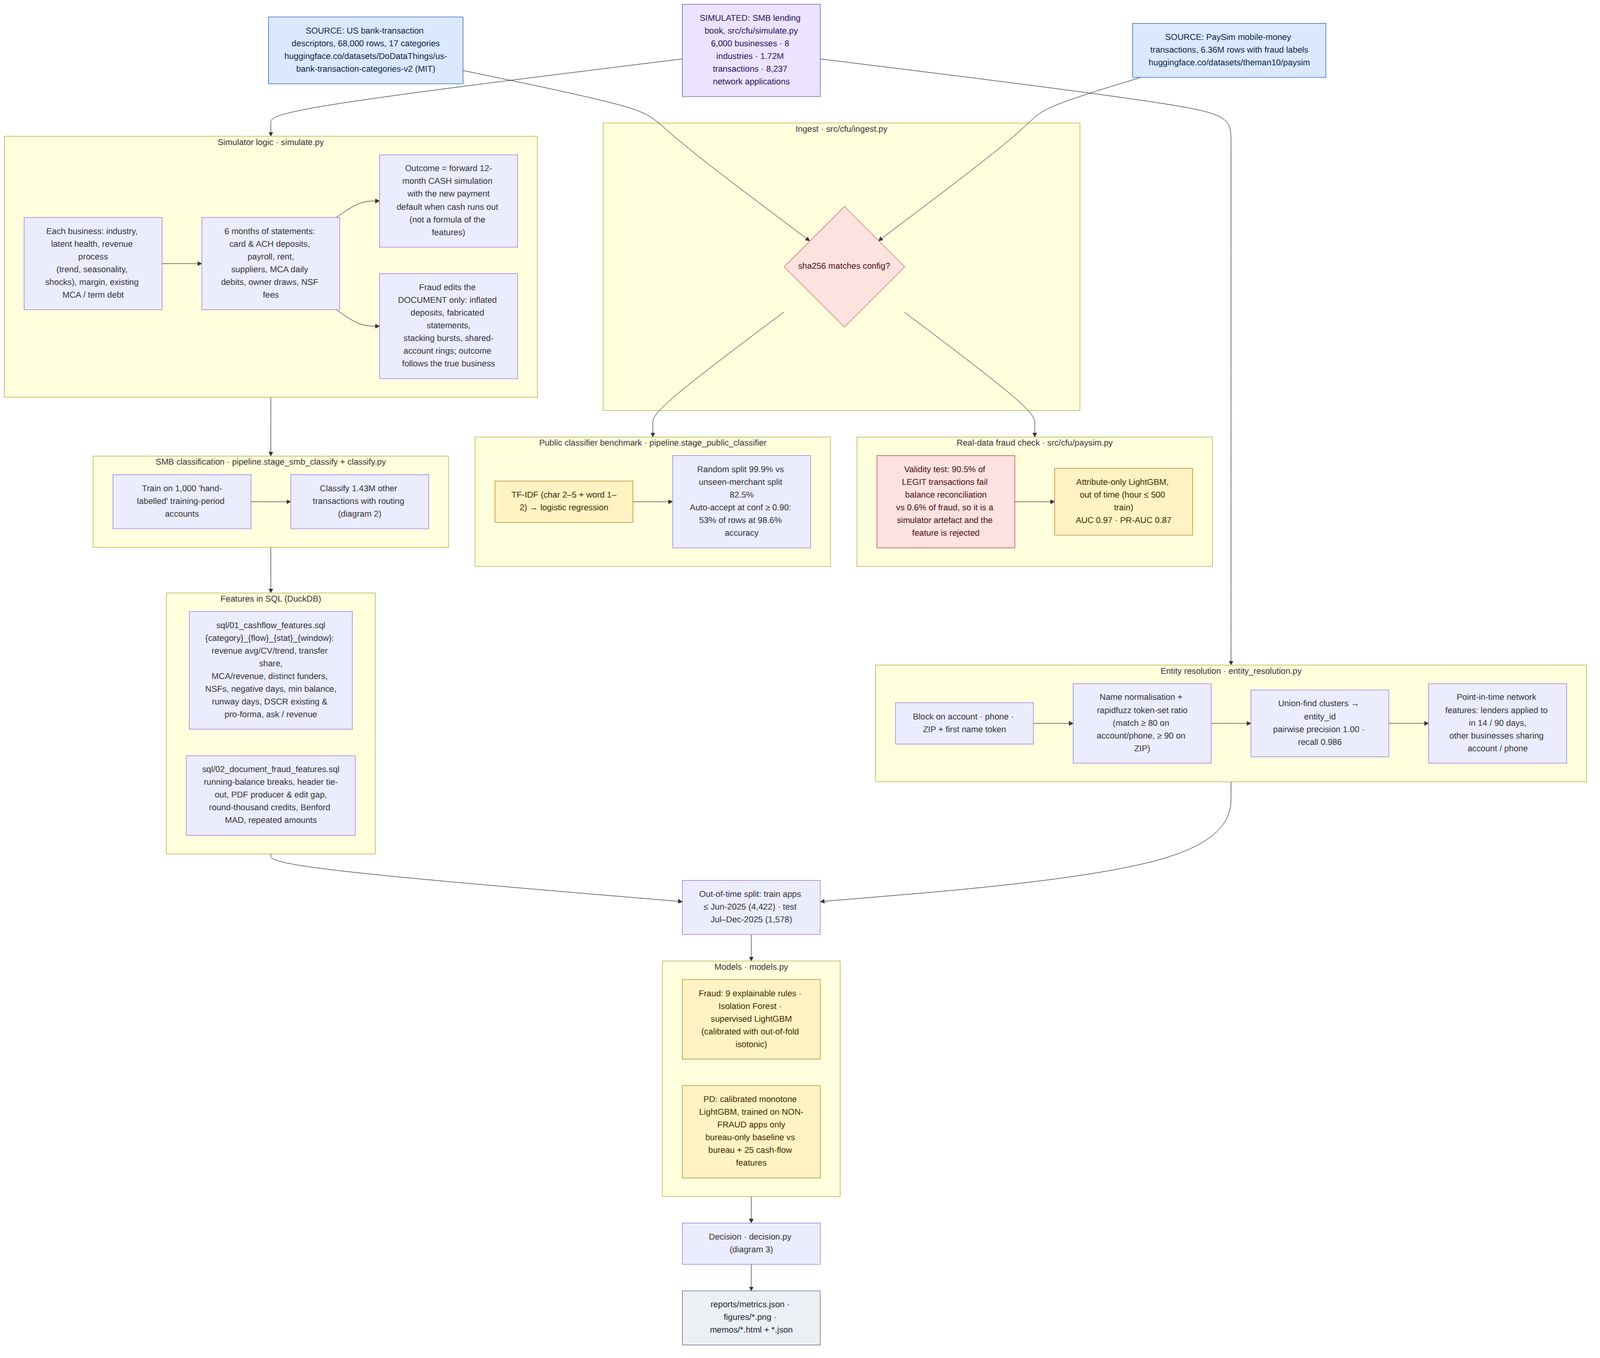
This note walks through an end-to-end small-business underwriting pipeline, from raw bank-transaction descriptions to a decision and a sized offer, and the design choices that mattered.
Executive summary
The question. How much better can a lender decide with bank-transaction data than with bureau data, and how do you stop doctored statements from turning that advantage into losses?
The approach. Build the full chain a cash-flow lender runs: classify every transaction, turn transactions into cash-flow features, check each statement and applicant for fraud, predict default, then size an offer the business can actually repay. Test on applications from a later period than the model was trained on.
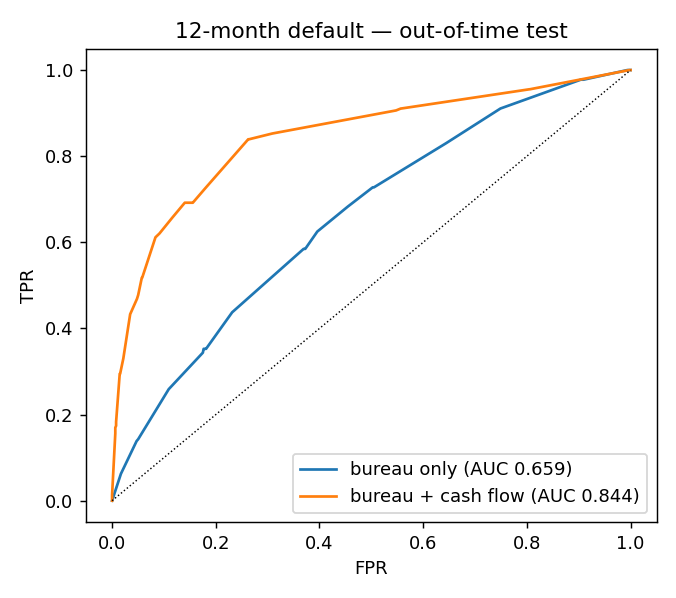
The answer. Cash-flow features lift default prediction from 0.659 to 0.844 AUC. But the credit model is fooled by edited statements, so fraud has to be screened first. With the gate in place, fraudulent loans funded fall from 47 to 4 and the bad rate falls from 7.1% to 5.3%.
The decision it supports. Screen fraud before credit, underwrite on cash flow, size offers from repayment capacity, route ambiguous transactions to an AI agent rather than trusting every prediction, and monitor stacking after funding.
Business outcomes
What the full design changes for a lender, on applications from a later period than the models were trained on:
| Business lever | Bureau-only lending | Fraud gate + cash-flow model + sized offers | What it means |
|---|---|---|---|
| Businesses funded | 790 | 1,083 | 37% more small businesses served |
| Bad rate | 7.5% | 5.3% | Growth without taking on more risk |
| Defaulted loans | About 59 | About 57 | More loans funded, slightly fewer defaults |
| Fraudulent loans funded | 25 (47 with cash-flow data but no gate) | 4 | Cash-flow data invites document fraud; the gate shuts it out |
| Portfolio P&L | $4.5M | $7.3M | +$2.8M, a 62% increase, on illustrative economics |
| Fraud review effort | n/a | Top 5% of applications reviewed catches 97% of fraud, 0.3% false positives | A small fraud team can cover the whole funnel |
| Underwriter time | Manual statement review | 84% of transactions classified in the fast lane; 99.95% resolved without a human | Analysts spend time on judgment, not tagging |
| Revenue accuracy | 1.9% of accounts misstate true revenue by more than 5% | 0.4% | Loan proceeds no longer counted as sales |
Defaulted loans are derived from funded count × bad rate. P&L assumes a good deal earns 17% of the advance and a default loses 65%. Results come from a simulated lending book and test method and relative lift, not market performance.
End to end in seven steps
| Step | What happens | Output |
|---|---|---|
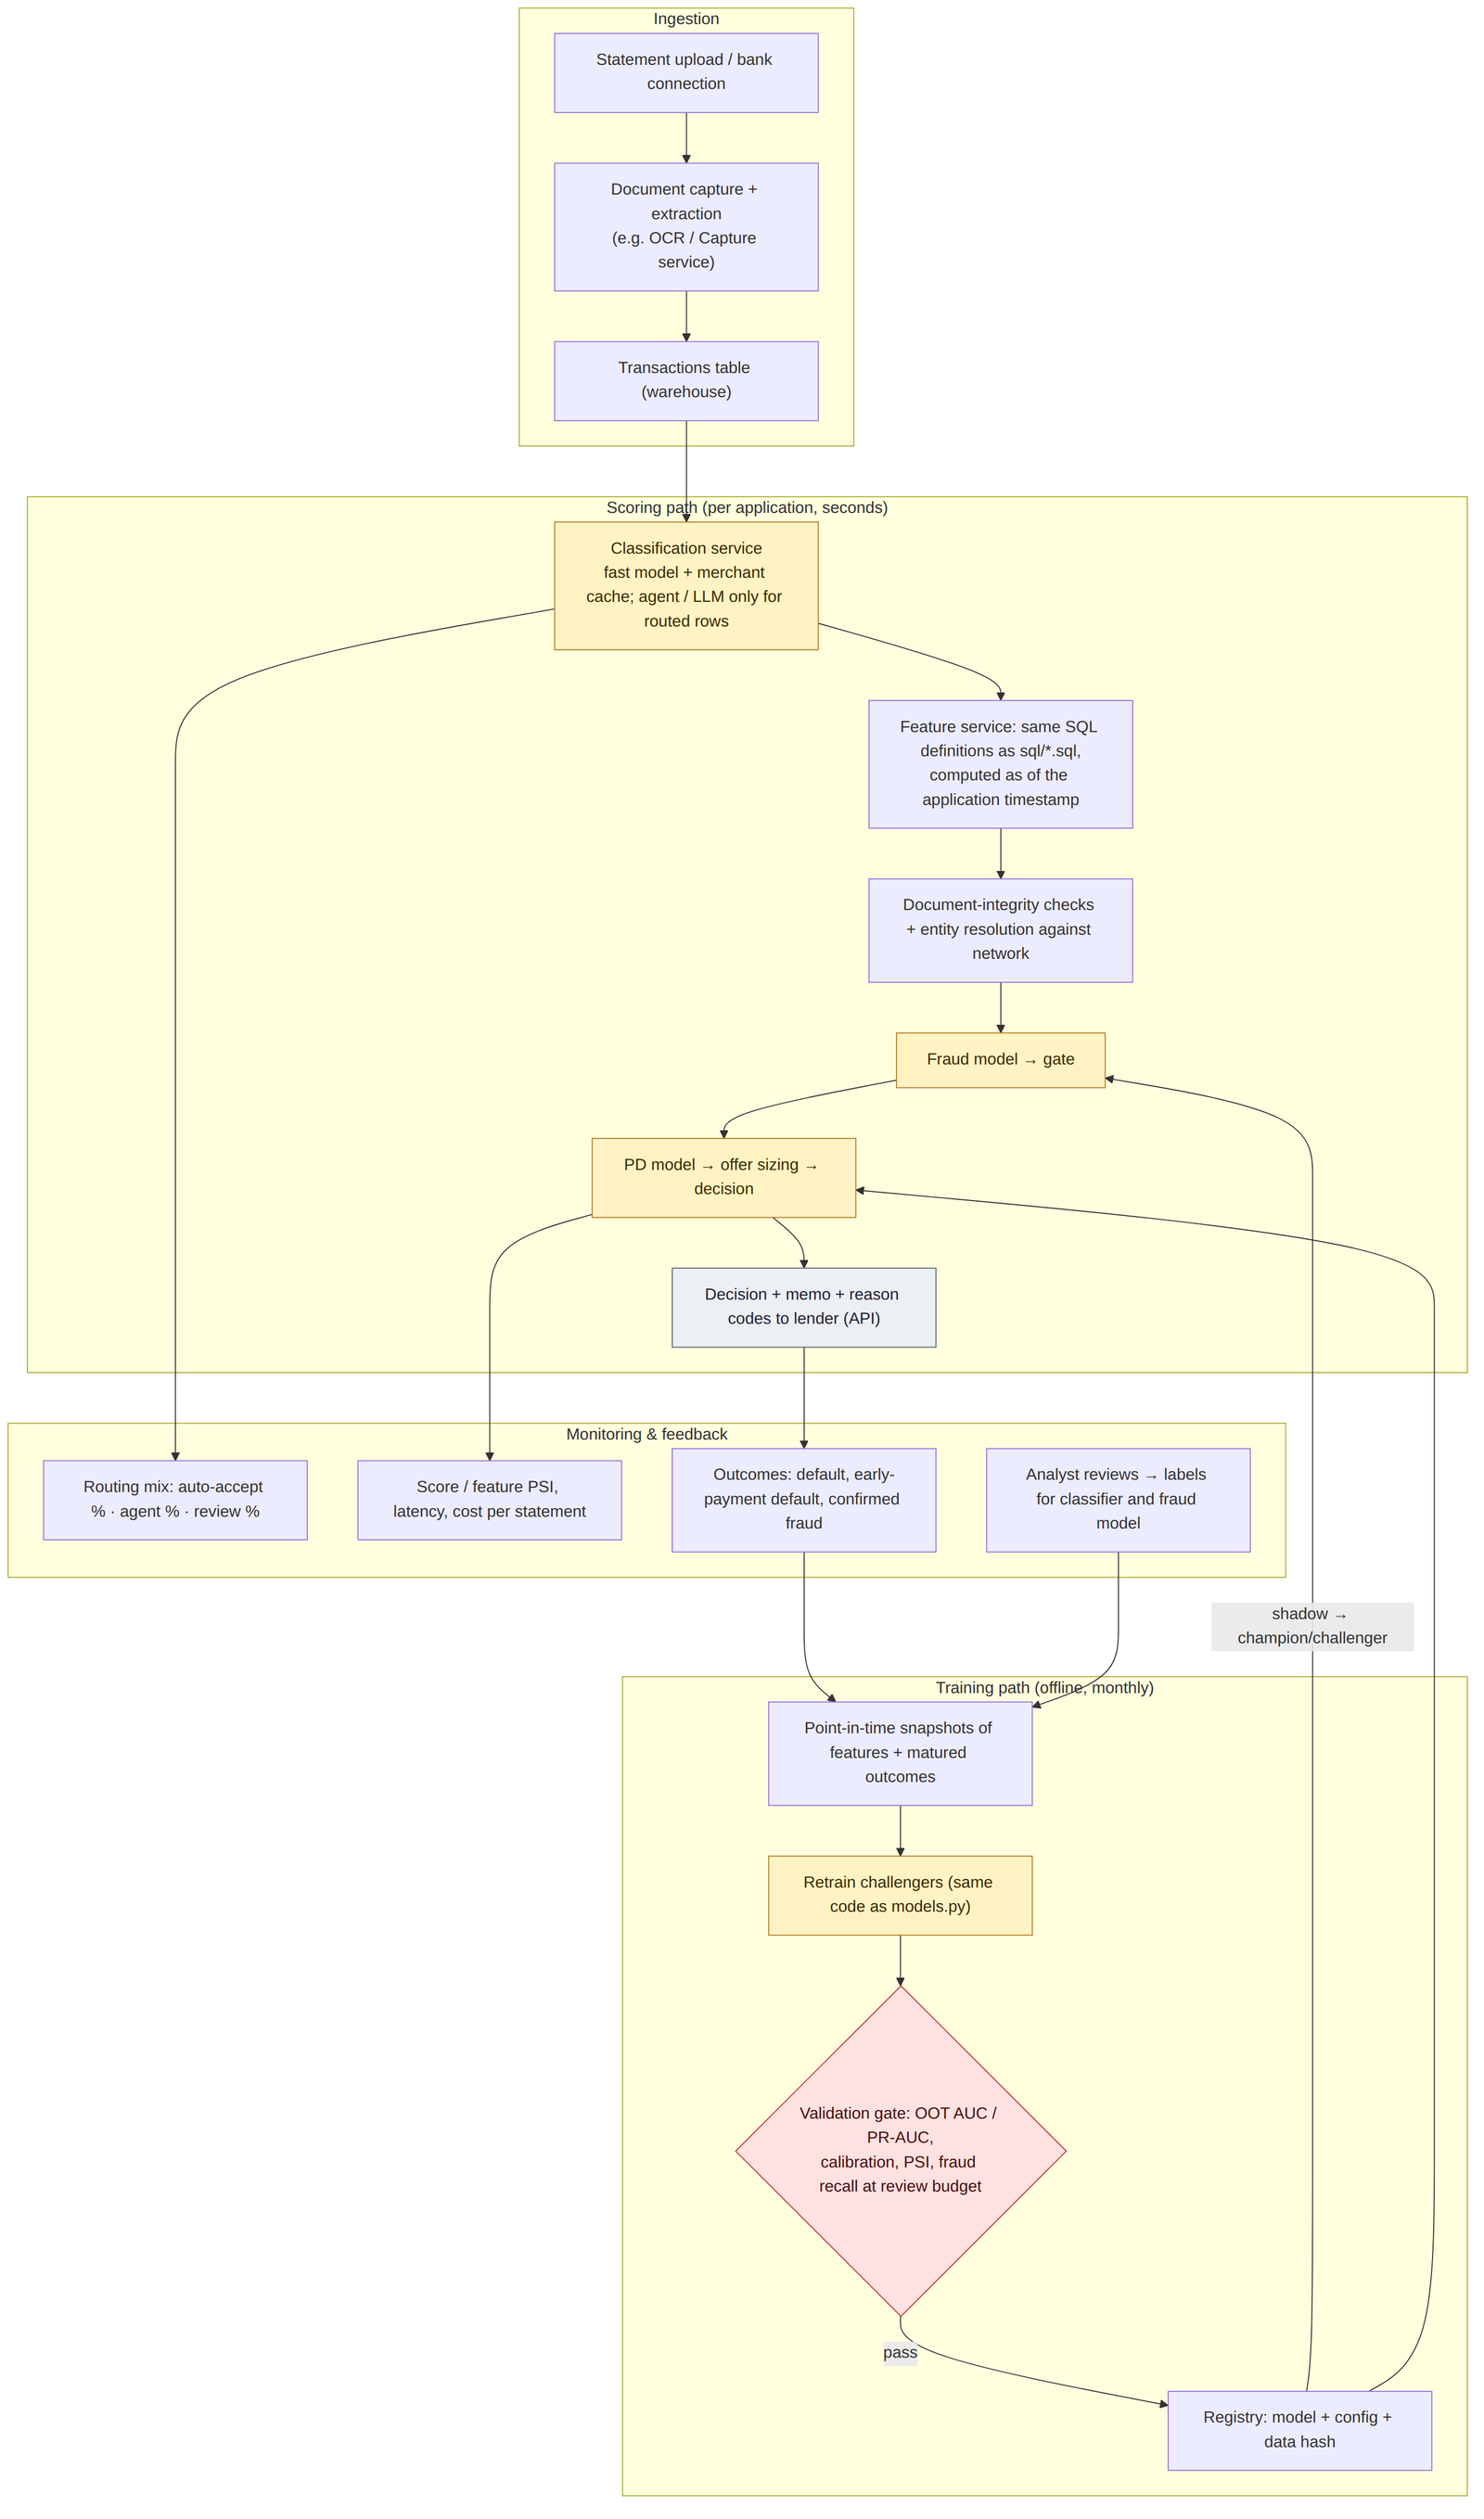
| 1. Source | Public benchmark datasets for transactions and fraud (both synthetic); a simulated lending book where default comes from forward cash and fraud edits only the documents | Statements, applications and outcomes |
| 2. Classify | Text model labels each transaction; generic, uncertain or large items go to an agent; leftovers go to a human | A category for every transaction |
| 3. Engineer features | SQL turns six months of classified transactions into 25 cash-flow features as of the application date | One feature row per application |
| 4. Check documents | Balance arithmetic, header tie-out, PDF metadata, round amounts, Benford test, template repetition | Document-integrity signals |
| 5. Resolve entities | Match the same business across lenders despite name variations | Application velocity and shared-identifier signals |
| 6. Score | Fraud model first, then the default model trained only on non-fraud cases | Fraud score, probability of default, reason codes |
| 7. Decide | Fraud gate, default bands, debt-capacity offer, one-page memo | Approve, refer or decline, with an offer amount |
What is public, what is synthetic and what is simulated
No public dataset links small-business bank transactions to loan outcomes, so this work combines public benchmark datasets with a simulator of its own, and says so plainly.
- Public benchmark datasets, both synthetic: 68,000 US bank-transaction descriptions in 17 categories, generated to mirror real US bank-statement formats using real merchant names (DoDataThings, MIT licence), and PaySim, 6.36 million labelled mobile-money transactions produced by a simulator calibrated on a real mobile-money provider's logs (Lopez-Rojas, Elmir and Axelsson, 2016).
- Simulated: a lending book of 6,000 small businesses across eight industries, with 1.72 million transactions and 8,237 applications across 40 lenders.
The simulator encodes mechanisms, not labels. Default is not a formula of the features: each business's cash is simulated forward twelve months with its true revenue process, margin, existing merchant-cash-advance and term-loan payments, the new loan payment and unobserved shocks. Default means the business runs out of cash. Fraud edits only the document the lender sees, such as inflated deposits, fabricated statements or bursts of applications to several lenders, while the outcome follows the true business. Honest borrowers create noise too: they shop for rates, deposit round-dollar checks and re-save PDFs.
The right way to read the results is as a test of method and relative lift, not as market-level performance.
Step one: get the transactions right
Every cash-flow feature depends on classifying transactions correctly. Misread a loan disbursement as revenue and a stretched business looks healthy, which is exactly what a stacker wants.
On the public dataset, the split matters more than the model. A random train/test split gives 99.9% accuracy because the same merchants appear on both sides. Holding out merchants the model has never seen gives 82.5%, which is what production looks like. Confidence routing recovers most of the gap: rows the model is at least 90% sure about make up 53% of the volume at 98.6% accuracy, and the rest go to further checks.
On small-business statements, routing goes beyond low confidence. Three kinds of rows go to an agent step:
- low-confidence predictions
- generic descriptions such as "DEPOSIT", "CHECK 1043" or "ZELLE FROM …"
- material credits larger than 20% of the account's monthly credits
The agent then works through tools in order: high-precision rules (funder names, payroll processors, fees), account context (a same-amount debit every month is rent), similar labelled examples, an optional language-model adjudication, and finally human review for anything still unresolved.
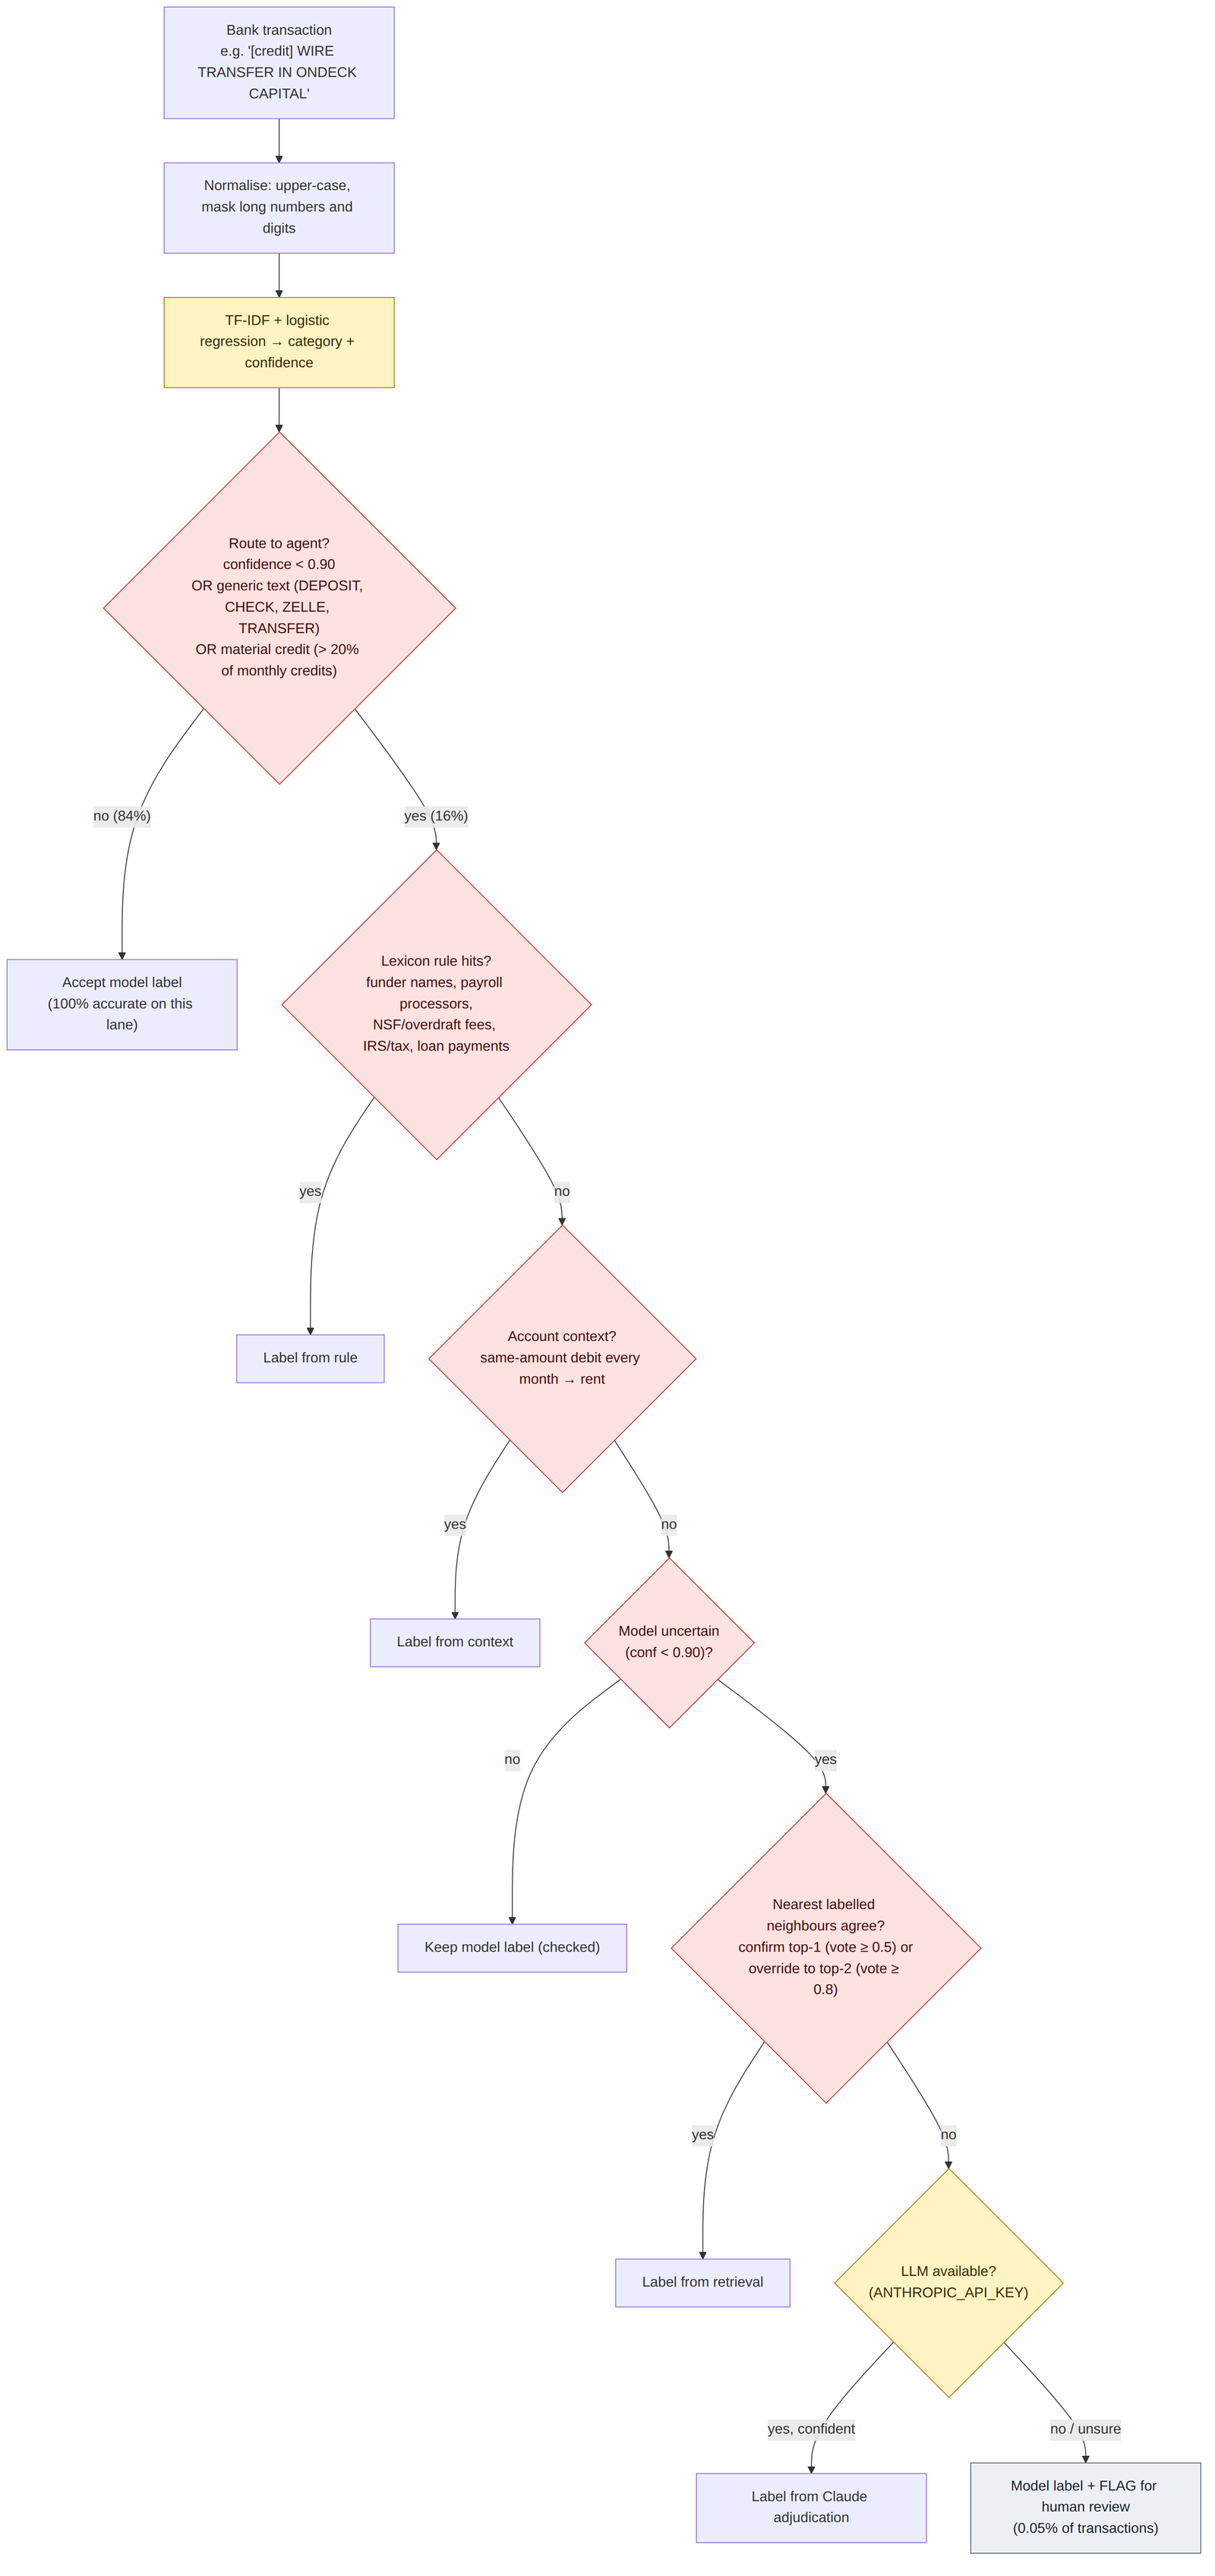
The effect is concentrated where it matters. Recall of loan proceeds rose from 66% to 100%, and the share of accounts with more than 5% error in true revenue fell from 1.9% to 0.4%. One rule I tested, "a round credit when the balance is low is an owner transfer", made things worse because honest customers pay round-dollar checks. It was removed.
Step two: cash-flow features in SQL
Features are written as SQL over classified transactions, computed as of the application date, and named by category, flow, statistic and window, for example revenue_in_avg_3m. Twenty-five cash-flow features join four bureau and firmographic fields. The most important ones:
| Feature | How it is built | What it tells an underwriter |
|---|---|---|
| True revenue, 3 and 6 months | Average monthly deposits classified as revenue, excluding transfers, loan proceeds and refunds | Real sales capacity, not cash shuffled between accounts |
| Revenue volatility and weakest month | Coefficient of variation of monthly revenue; lowest month ÷ average | How exposed repayment is to a bad month |
| Revenue trend | Last three months ÷ prior three months | Growing or shrinking business |
| Transfer share | Owner transfers ÷ (revenue + transfers) | Owner propping up the account |
| MCA burden and funders | Merchant-cash-advance debits ÷ revenue; count of distinct funders in 3 months | Existing debt load and stacking |
| Debt service and opex ratios | Debt payments ÷ revenue; operating costs ÷ revenue; payroll ÷ revenue | Margin left to service new debt |
| NSF events and negative days | Count of insufficient-funds fees; days with a negative end-of-day balance | Cash stress, already visible |
| Minimum and average balance | Lowest balance; average balance ÷ monthly revenue | Cushion against shocks |
| Liquidity runway | Average balance ÷ average daily outflow, in days | How long the business survives a revenue stop |
| Coverage today and pro forma | Operating cash flow ÷ existing debt service, and ÷ (existing + new payment) | Whether the new loan is affordable |
| Ask size | Requested amount ÷ monthly revenue | Over-borrowing relative to scale |
Plus bureau score, years in business, industry and log requested amount for the baseline comparison.
Step three: fraud as a gate
Fraud signals come from two places.
The document itself. Each running balance should equal the previous balance plus the transaction, and statement headers should tie out; naive edits break that arithmetic. Other checks look at which software produced or modified the PDF, the share of round-thousand deposits, deviation from Benford's law, and transactions that repeat month after month like a template.
The network. Entity resolution matches the same business across applications to different lenders, despite name variations, using blocking on account, phone and location, fuzzy name matching and clustering. On the simulated network it reached pairwise precision of 1.00 and recall of 0.986. It produces two strong signals: how many lenders the same business applied to in the last 14 and 90 days, and how many apparently different businesses share one bank account or phone.
| Fraud detector | PR-AUC | Recall at 5% review |
|---|---|---|
| Nine explainable rules | 0.56 | 57% |
| Isolation Forest (unsupervised) | 0.64 | 68% |
| Supervised gradient-boosted model | 0.96 | 97% |
Out-of-time test, July–December 2025 applications. At a 0.30 score threshold the false-positive rate is 0.3%.
Here is why fraud must be a gate. These are the probabilities of default the credit model assigned to each fraud type, and what actually happened:
| Fraud type | Predicted default | Actual default | Caught by gate |
|---|---|---|---|
| Inflated deposits, sophisticated | 3.5% | 52% | 95% |
| Inflated deposits, naive | 8.1% | 55% | 100% |
| Fabricated statement | 16.1% | 91% | 100% |
| Stacking across lenders | 20.1% | 60% | 75% |
Doctored statements make weak businesses look strong, so confirmed fraud is excluded from credit-model training, and the fraud score routes applications to review before credit is ever assessed. Stacking is the hardest case: at the moment of application, a lender can only see applications made before it. Closing that gap needs post-funding monitoring.
Step four: the default model and the offer
The default model is a calibrated gradient-boosted model with monotone constraints on the variables a credit committee would insist on, trained only on non-fraud applications. Adding cash-flow features lifts AUC from 0.659 to 0.844 on the out-of-time test. The strongest drivers are liquidity runway, requested amount relative to monthly revenue, and pro-forma coverage.
The decision has five outcomes. A fraud score of 0.30 or more is referred to the fraud team. Otherwise, a default probability of 30% or more is declined. The offer is then sized from debt capacity: free operating cash flow after existing debt, divided by a 1.25× coverage target, gives the maximum payment, which converts into the maximum advance. Offers below $5,000 are declined for capacity, probabilities of 12% or less are approved, and the rest go to an analyst. Each decision produces a one-page memo with the cash-flow profile, the top risk drivers and any fraud flags.
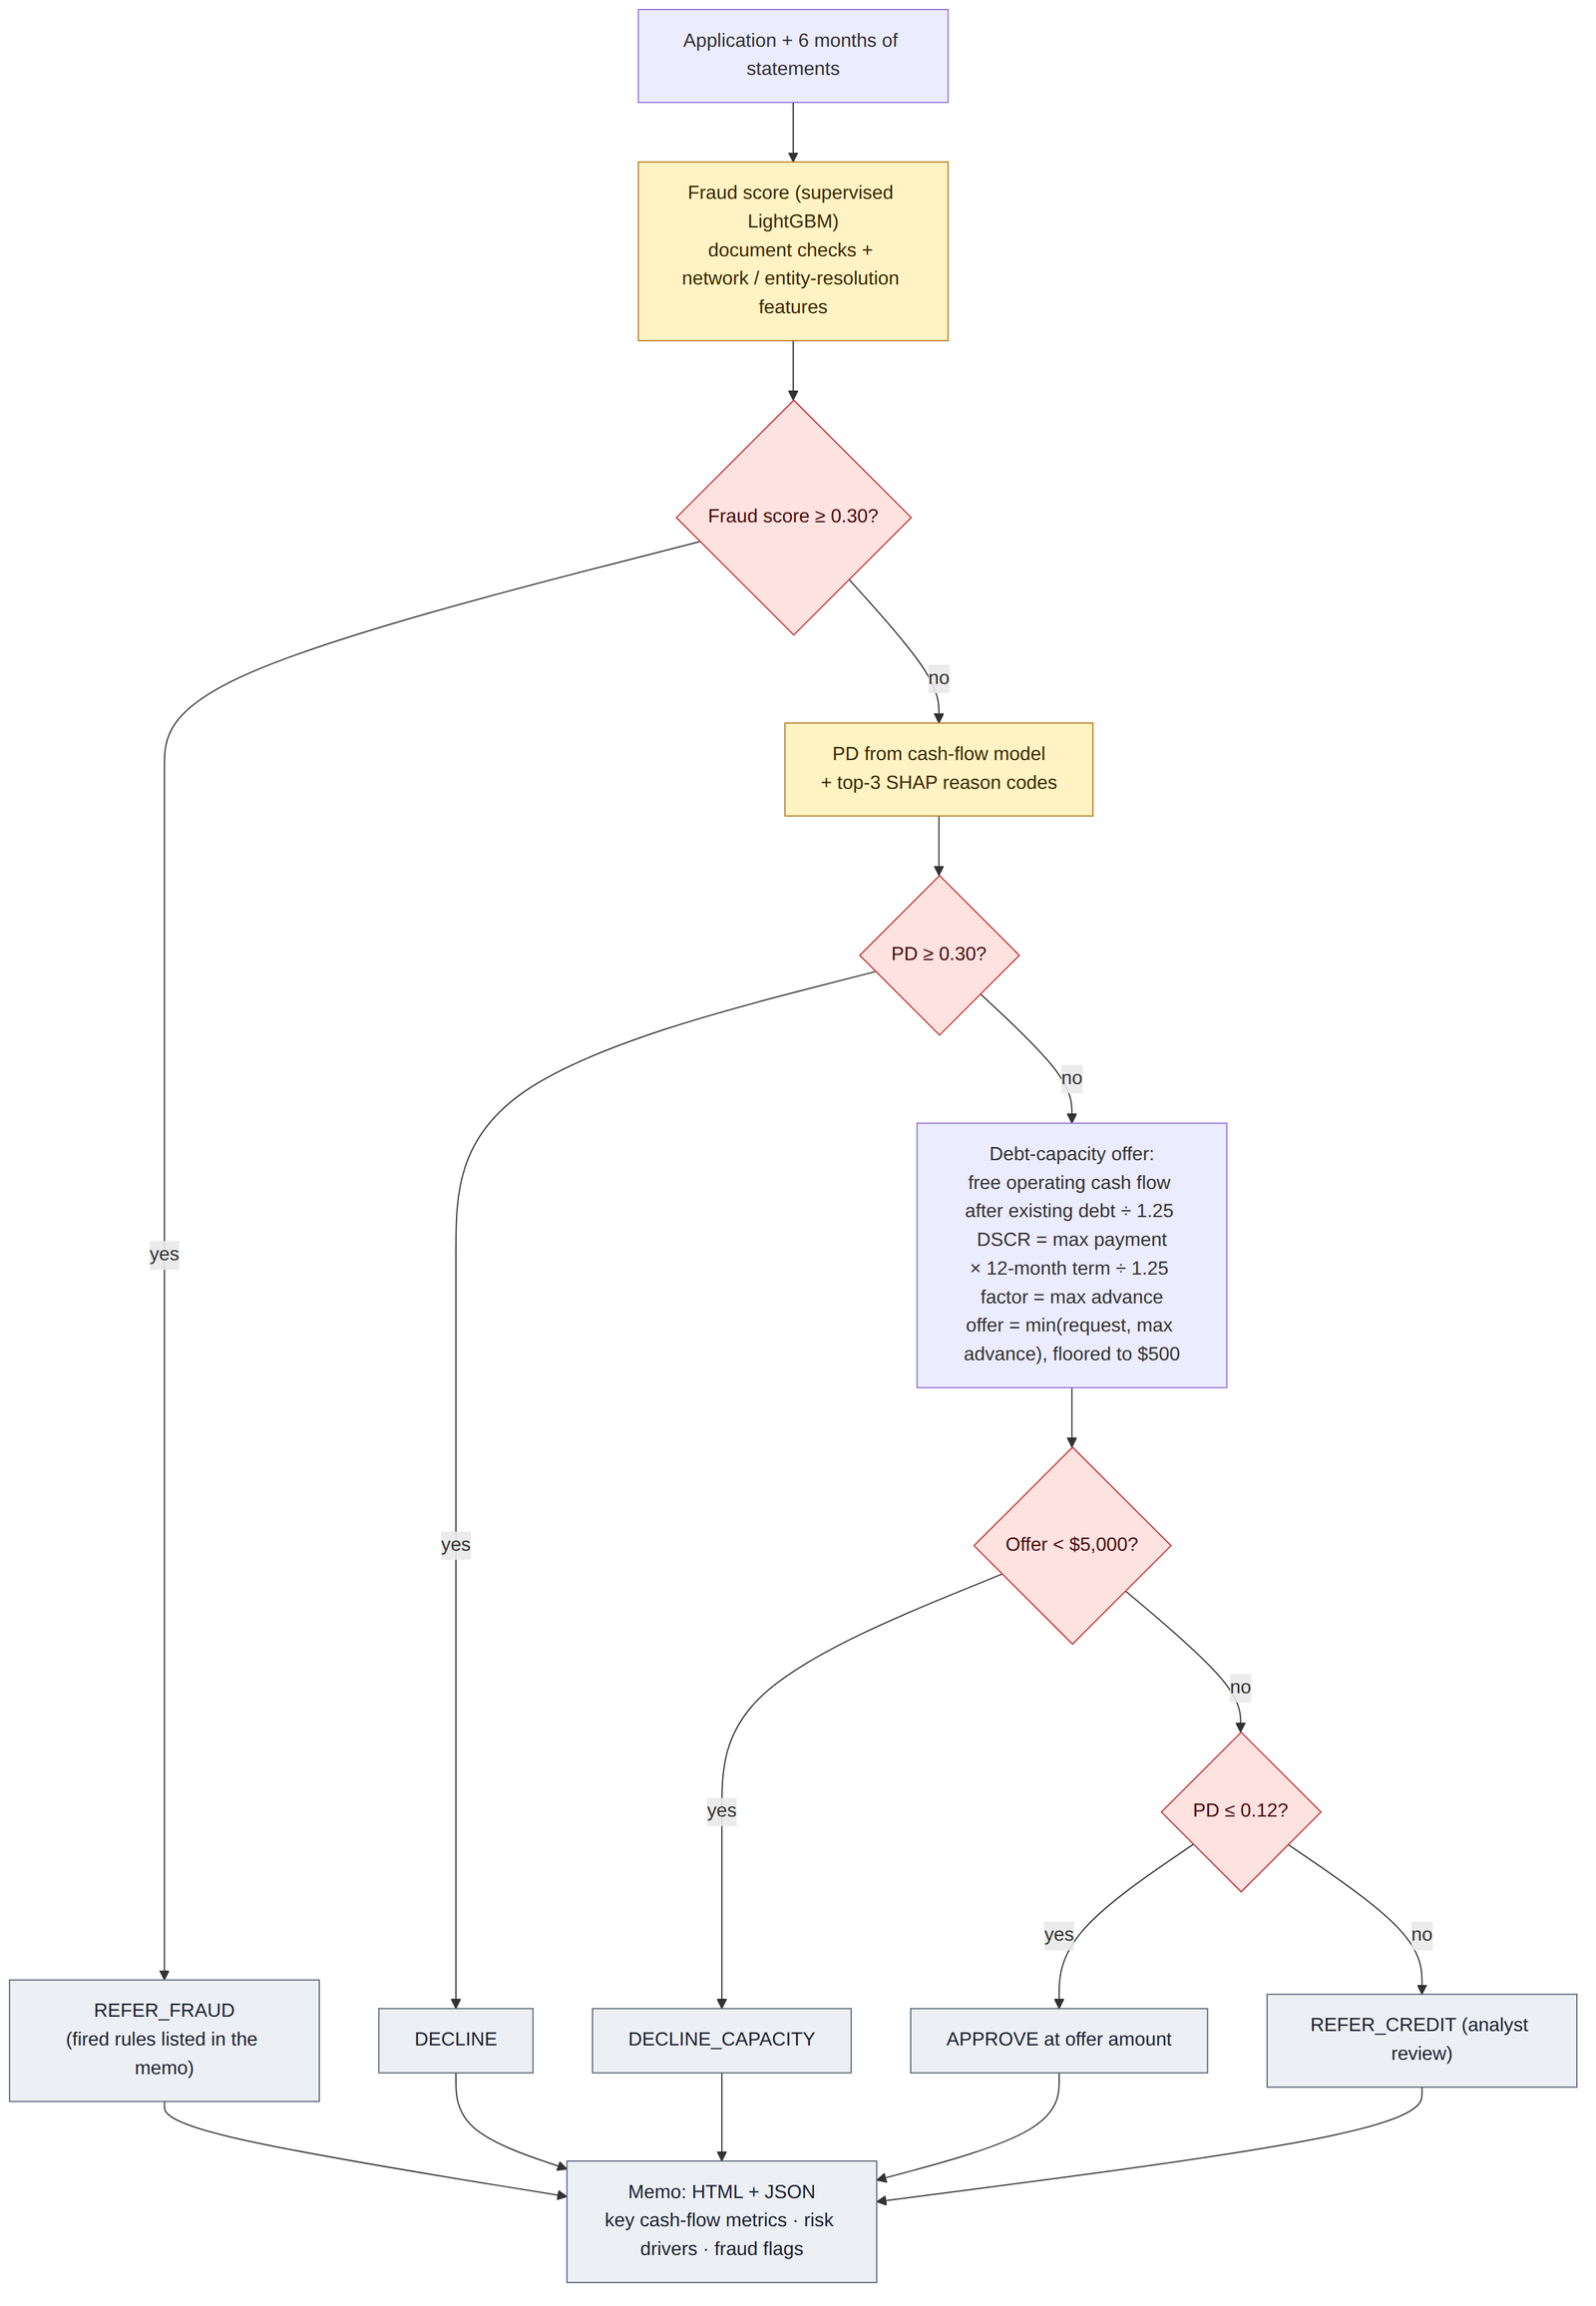
What the policy is worth
| Policy (test window) | Funded | Bad rate | Fraud funded | P&L |
|---|---|---|---|---|
| Bureau-only default model | 790 | 7.5% | 25 | $4.5M |
| Cash-flow model, no fraud gate | 1,129 | 7.1% | 47 | $6.1M |
| Fraud gate, then cash-flow model, then sized offer | 1,083 | 5.3% | 4 | $7.3M |
Illustrative economics: a good deal earns 17% of the advance; a default loses 65%.
The full design funds more businesses than the bureau-only policy, at a lower bad rate, with almost no fraud, and earns the most.
Recommendations
- Run fraud as a gate before credit, not as a credit-model input, and exclude confirmed fraud from credit-model training.
- Underwrite on cash flow. It is where most of the predictive power is.
- Size every offer from debt capacity, so stretched borrowers get a smaller advance rather than a binary yes or no.
- Route transactions by confidence, generic wording and dollar materiality, and measure classification by its effect on true revenue, not overall accuracy.
- Add post-funding monitoring to catch stacking that happens after the decision.
- Validate on real outcomes before production: each lender's own funded book, its own default definition, compared at its own approval rate.
A note on public data that turned out to be misleading
Ledger arithmetic is a strong fraud signal on bank statements, so I tested it on PaySim first. 90.5% of legitimate PaySim transactions fail origin-balance reconciliation, versus 0.6% of fraudulent ones. That is an artefact of how the simulator maintains balances, not a fraud mechanism, and a model fed those fields learns the artefact. The fields were rejected. Checking whether a signal means what you think it means is as important as finding it.
The companion note, The 0.96 AUC That Wasn't, applies the same discipline to a default and loss model on 772,000 real SBA loans.
Sources
Data
- DoDataThings. US Bank Transaction Categories v2 (synthetic; MIT licence). Hugging Face: huggingface.co/datasets/DoDataThings/us-bank-transaction-categories-v2
- Lopez-Rojas, E. A., Elmir, A. and Axelsson, S. (2016). "PaySim: A financial mobile money simulator for fraud detection." 28th European Modeling and Simulation Symposium (EMSS), Larnaca, Cyprus. Copy used: huggingface.co/datasets/theman10/paysim
- Small-business lending book: simulated by the author for this study (code in the repository below).
Methods referenced
- Benford, F. (1938). "The law of anomalous numbers." Proceedings of the American Philosophical Society, 78(4), 551–572.
- Liu, F. T., Ting, K. M. and Zhou, Z.-H. (2008). "Isolation Forest." IEEE International Conference on Data Mining (ICDM).
- Ke, G. et al. (2017). "LightGBM: A highly efficient gradient boosting decision tree." Advances in Neural Information Processing Systems 30.
Independent research, not lending advice; economics are illustrative. Analysis, code, charts and text were produced with AI assistance and reviewed by the author.