The 60/40 portfolio looks balanced. It is not. Over the last twenty years, about 81% of its risk came from equities. While long Treasuries reliably rose when stocks fell, that concentration was well hidden. In 2022, when inflation pushed stocks and bonds down together, it cost a 60/40 portfolio about 23%.
A portfolio built by balancing risk instead of dollars lost under 8% that year. Over the full twenty years, however, it did not beat a simpler alternative. Both facts matter for anyone setting a strategic allocation, a risk budget or a leverage policy.
Executive summary
The question. Should a multi-asset portfolio be sized by risk rather than by dollars, and would that have protected it when the stock-bond hedge failed?
The approach. Build five portfolios from four real ETFs (US equities, long Treasuries, gold and broad commodities) with dividends, T-bill financing and trading costs, from 2006 to 2026. Set every weight from trailing data only, rebalance monthly, and compare full-period results, sub-periods, crisis years and cost stress. All rules were fixed before results were examined.
The answer. Risk parity diversified risk far better and cut the 2022 loss from 23% to under 8%. Over the full period, though, its Sharpe ratio (0.60 levered, 0.65 unlevered) did not beat 60/40 scaled to a volatility target (0.71). Results flipped between the first and second decades, and leverage sized on recent calm produced the worst drawdown of all in March 2020.
The decision it supports. Choose the allocation by the scenario the institution cannot survive. Report and limit risk by contribution, not dollars; stress-test against a positive stock-bond correlation; and put hard caps and intra-month triggers on any volatility-scaled leverage.
Business outcomes
| Dimension | 60/40 | 60/40 at 10% volatility | Risk parity at 10% volatility | What it means |
|---|---|---|---|---|
| Share of risk from equities | 81% | 81% | 22% | 60/40 is an equity bet with a bond cushion |
| 2022 return | -23.3% | -18.0% | -7.6% | Real assets did the hedging bonds could not |
| 2022 loss on a $1bn portfolio | About $233 million | About $180 million | About $76 million | About $157 million of capital preserved versus 60/40 |
| Annual return, 2006–2026 | 8.4% | 9.5% | 8.1% | Over the full period the simpler fix earned about 1.4 points a year more |
| Sharpe ratio, 2006–2026 | 0.63 | 0.71 | 0.60 | No single winner on risk-adjusted return |
| Sharpe ratio, 2006–2015 / 2016–2026 | 0.68 / 0.59 | 0.91 / 0.55 | 0.43 / 0.75 | The winner depended on the regime |
| Worst drawdown | -31% (2008–09) | -24% (Mar 2020) | -27% (Mar 2020) | Leverage sized on calm is exposed to sudden shocks |
All figures after 5 bp per unit of turnover and, for levered portfolios, financing at the 3-month T-bill rate plus 0.50%. Dollar figures apply measured returns to an illustrative $1bn portfolio. Period: June 2006 to October 2026.
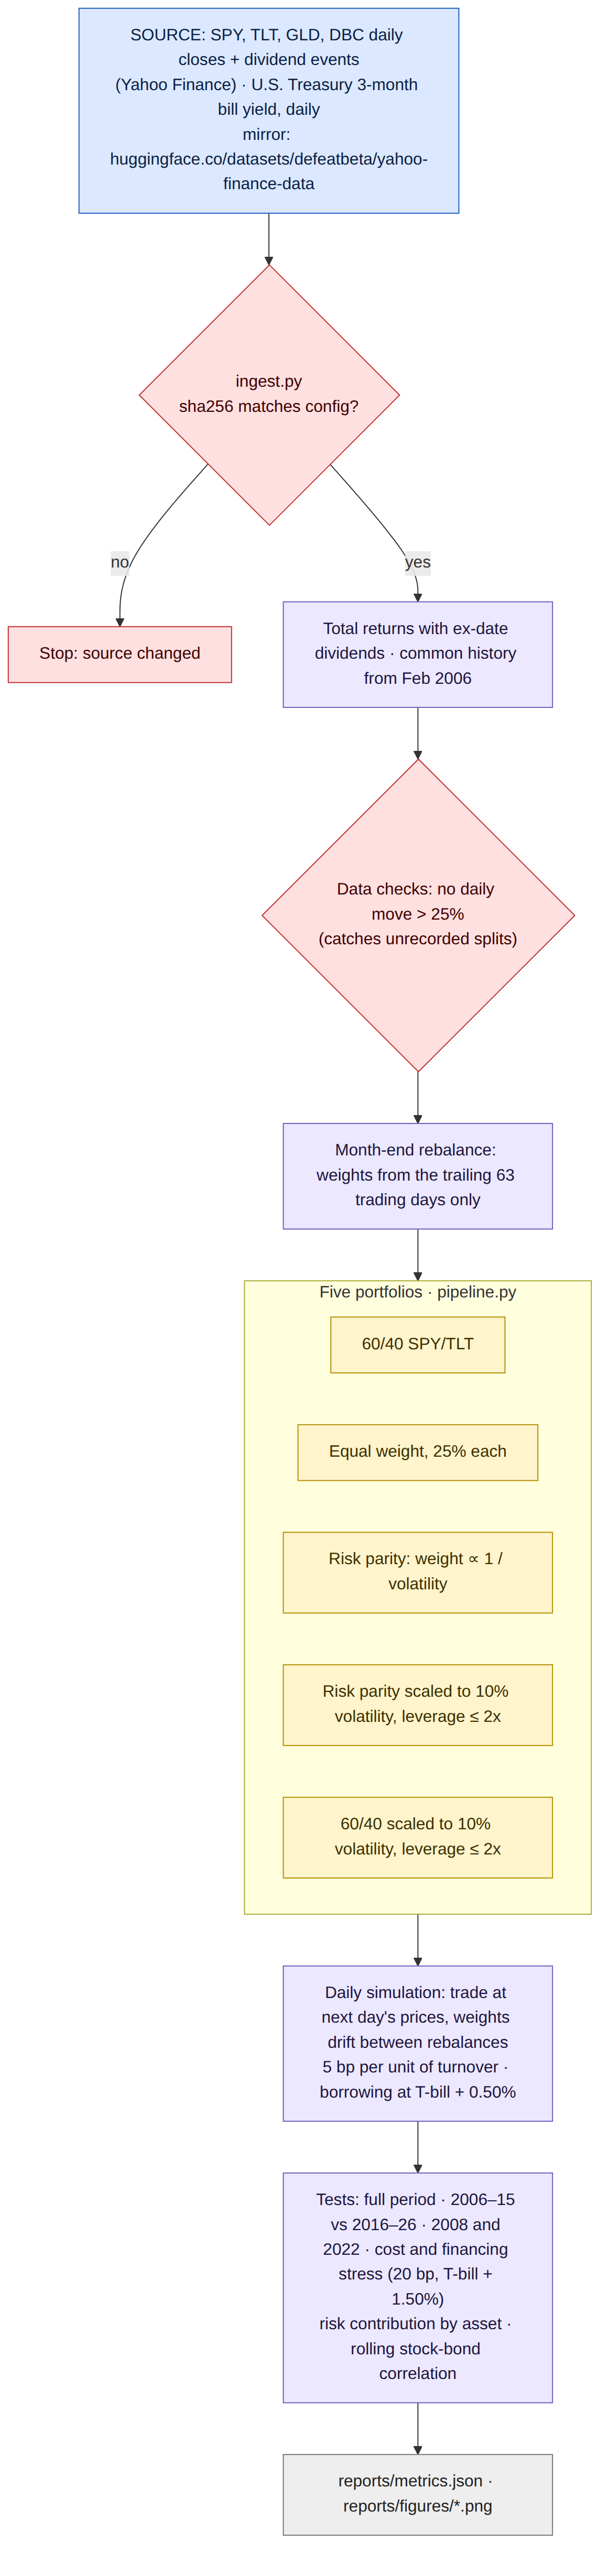
End to end in five steps
| Step | What happens | Output |
|---|---|---|
| 1. Source | Daily closes and dividends for SPY, TLT, GLD and DBC; daily 3-month T-bill yields; files checksum-pinned | Raw data with provenance |
| 2. Build returns | Total returns with ex-date dividends; guard rejects any unexplained daily move above 25% (none found) | Daily return matrix from February 2006 |
| 3. Size | At each month-end, estimate volatility and covariance from the previous 63 trading days only; set weights for five portfolios | Monthly target weights |
| 4. Simulate | Trade at the next day's prices, let weights drift, charge turnover and financing costs | Daily portfolio returns |
| 5. Test and translate | Full period, two sub-periods, 2008 and 2022, cost and financing stress, risk contribution, rolling stock-bond correlation, $1bn translation | Performance, risk and business tables |
Five portfolios
| Portfolio | Rule | Leverage |
|---|---|---|
| 60/40 | 60% SPY, 40% TLT, rebalanced monthly | None |
| Equal weight | 25% in each of the four ETFs | None |
| Risk parity | Each asset weighted in proportion to 1 / its trailing volatility | None |
| Risk parity at 10% volatility | Risk-parity weights scaled so expected portfolio volatility is 10% | Up to 2x, average 1.29x |
| 60/40 at 10% volatility | 60/40 weights scaled to the same 10% target | Up to 2x, average 1.20x |
Volatility and covariance use the previous 63 trading days. The volatility-targeted 60/40 is included so leverage is not mistaken for diversification.
Where the risk really comes from
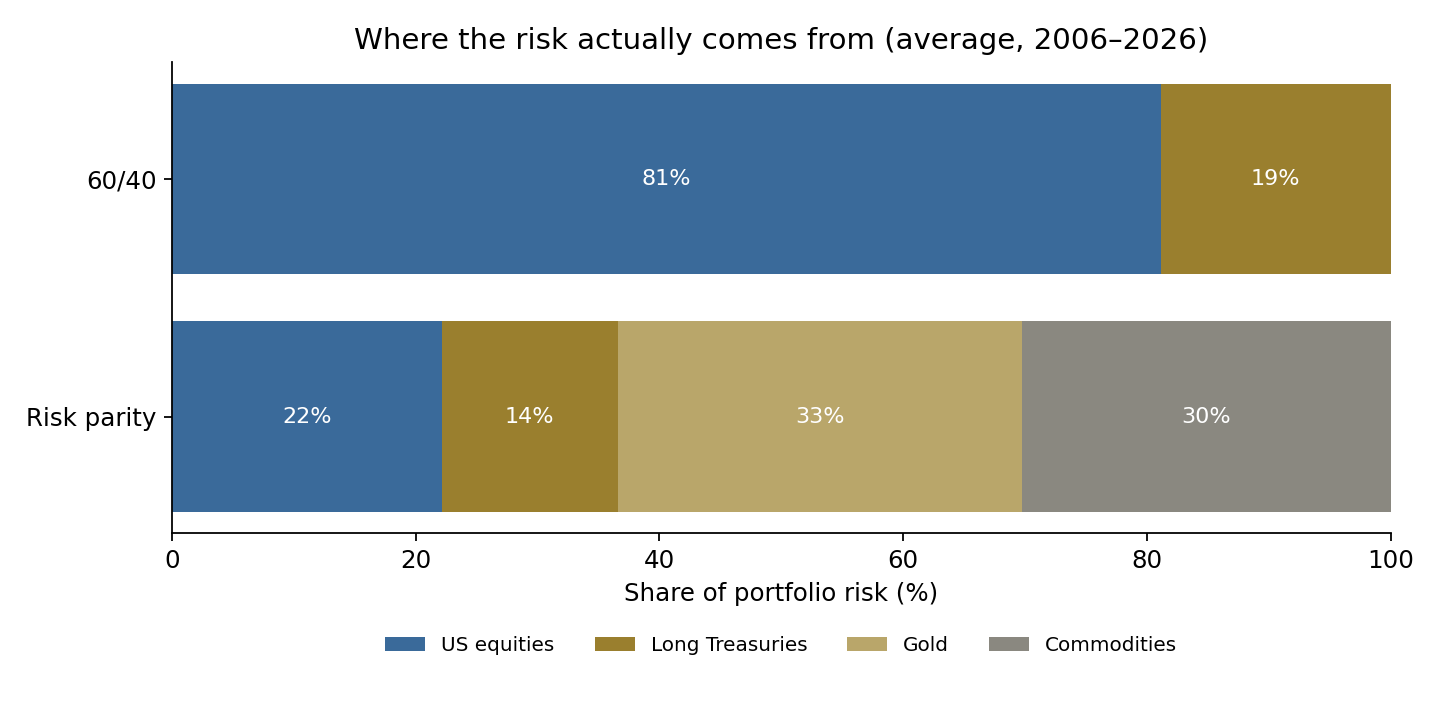
Because equities move far more than most other assets, the 60% in stocks drove about 81% of the 60/40 portfolio's variance. Risk parity spread the risk across all four assets: about 22% equities, 14% Treasuries, 33% gold and 30% commodities. That is a genuine change in what the portfolio is exposed to, not a cosmetic one.
The hedge that stopped working
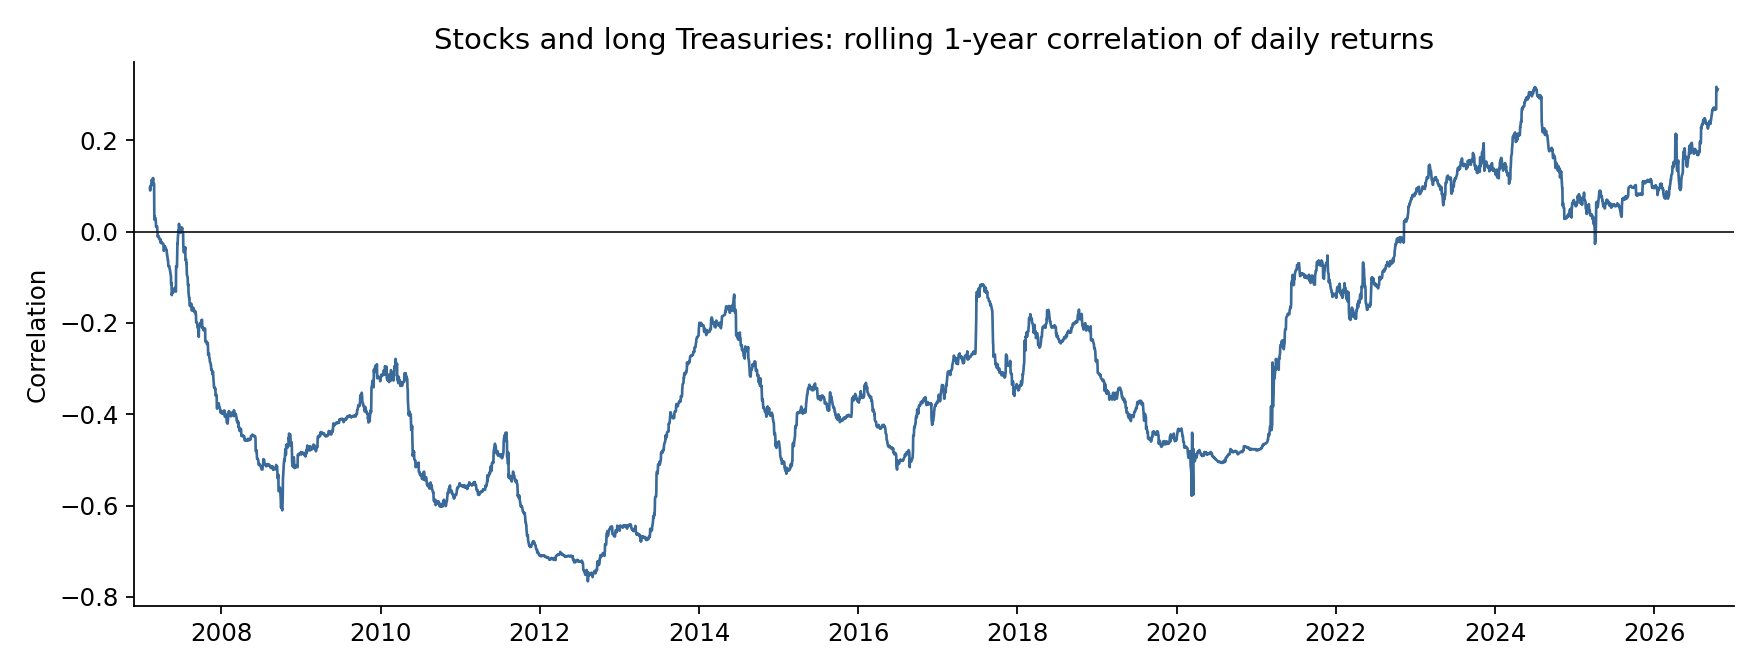
From 2006 to 2020 the one-year correlation between stocks and long Treasuries averaged -0.41: bonds rose when stocks fell, which made the 60/40 portfolio's equity concentration tolerable. Since 2022 it has averaged +0.09. With inflation risk dominant, bonds stopped hedging, and the portfolio's true concentration showed.
Results
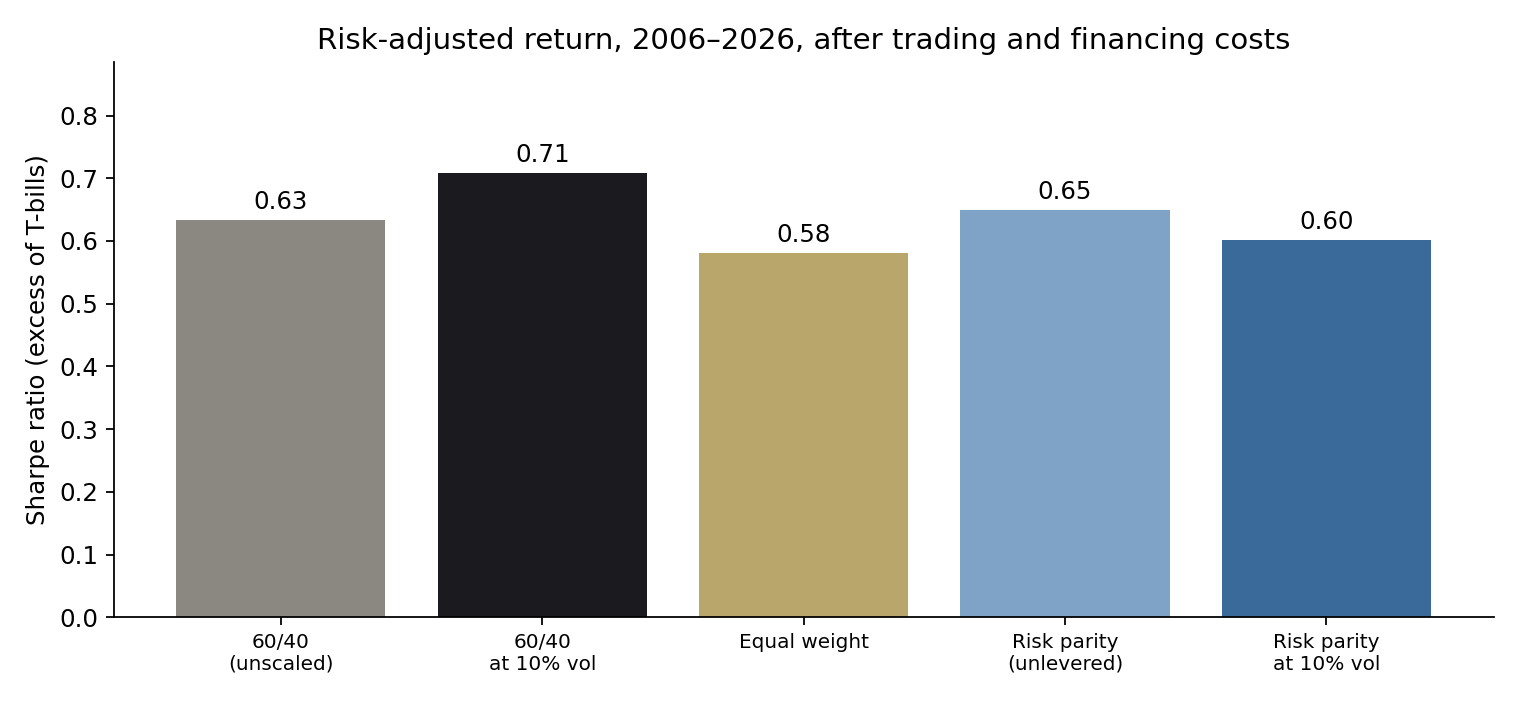
| Portfolio | Annual return | Volatility | Sharpe | Worst drawdown | 2008 | 2022 |
|---|---|---|---|---|---|---|
| 60/40 | 8.4% | 11.1% | 0.63 | -31% | -13.4% | -23.3% |
| 60/40 at 10% volatility | 9.5% | 11.3% | 0.71 | -24% | -14.4% | -18.0% |
| Equal weight | 7.3% | 10.1% | 0.58 | -28% | -9.6% | -8.7% |
| Risk parity (unlevered) | 7.5% | 9.2% | 0.65 | -21% | +0.5% | -10.2% |
| Risk parity at 10% volatility | 8.1% | 11.2% | 0.60 | -27% | -6.0% | -7.6% |
Realised volatility of the targeted portfolios ran at about 11.2% against the 10% target, because volatility is estimated from trailing data. Cost stress (20 bp turnover, T-bill + 1.50% financing) lowers the levered risk-parity return to 7.5% and its Sharpe ratio to 0.55.
Three findings stand out.
Risk parity protects in inflationary drawdowns. In 2022 the levered risk-parity portfolio lost 7.6% against 23.3% for 60/40, because commodities (+19%) and gold (roughly flat) offset losses in equities (-18%) and long Treasuries (-31%). In 2008 the unlevered version was roughly flat while 60/40 lost 13.4%.
It did not win over the full period. The best Sharpe ratio came from the simplest upgrade, 60/40 scaled to a volatility target. Risk parity's large allocation to commodities was costly: broad commodities lost about 7% a year from mid-2008 to 2020. In 2022 its heavy Treasury weight hurt (long Treasuries fell 31%), while commodities gained 19% and gold was roughly flat.
The winner depended on the decade. From 2006 to 2015, volatility-targeted 60/40 had a Sharpe ratio of 0.91 against 0.43 for volatility-targeted risk parity. From 2016 to 2026 the order reversed, 0.55 against 0.75. A single full-period backtest hides that.
The leverage lesson
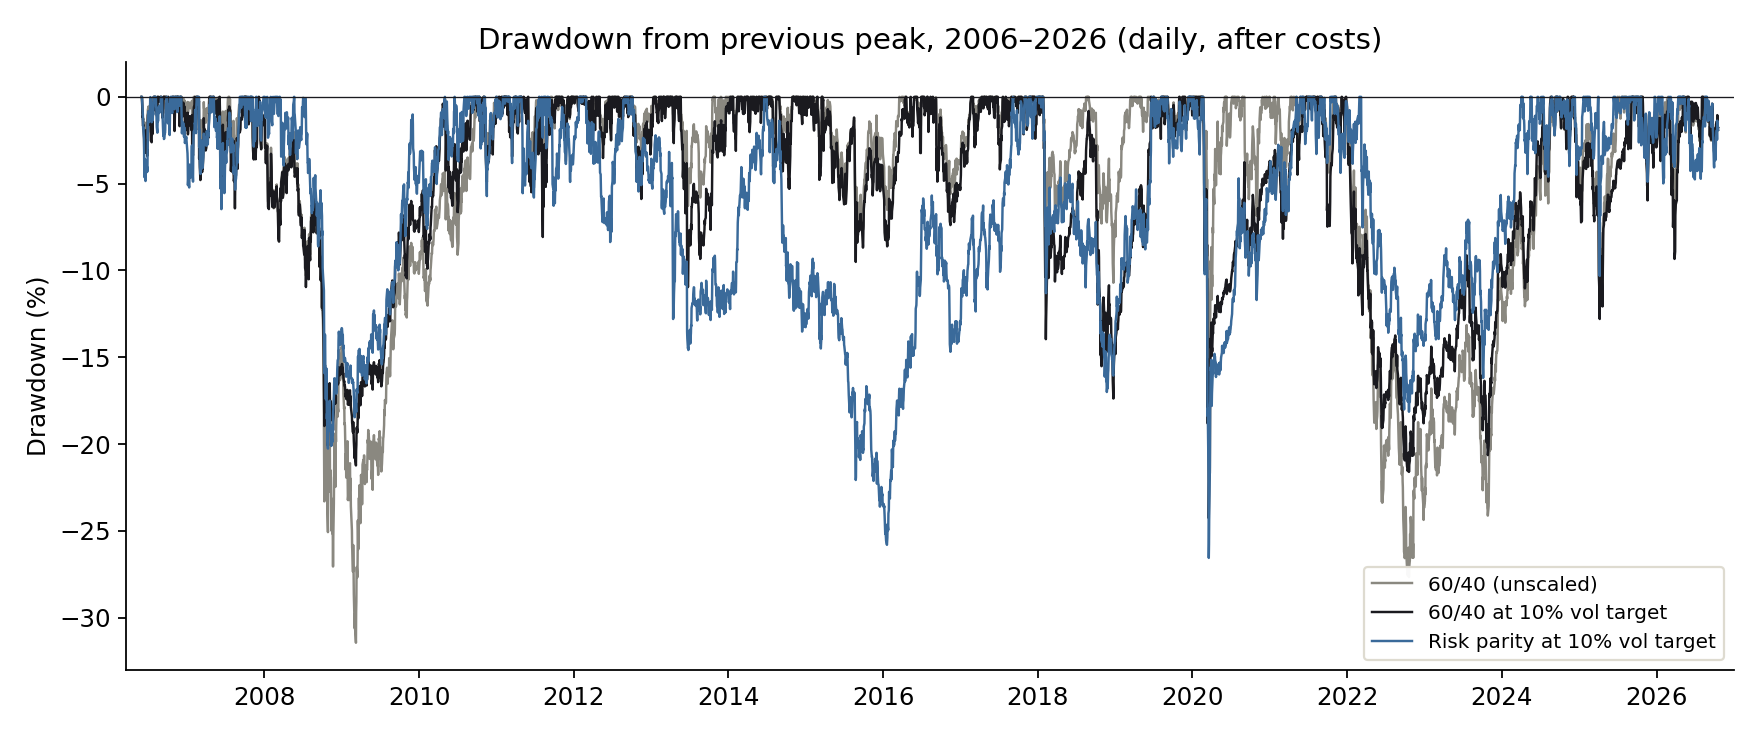
Both volatility-targeted portfolios had their worst drawdown in February and March 2020; levered risk parity fell about 27% in four weeks. Volatility targeting sizes exposure on recent calm. Going into the COVID crash, trailing volatility was low, so exposure was high, and volatility rose faster than a monthly rebalance could respond. Sizing by risk protects against slow crises and can amplify sudden ones.
Recommendations
- Measure and limit risk by contribution. Report each sleeve's share of portfolio variance alongside its dollar weight, and set limits on contribution, not just allocation.
- Stress-test a positive stock-bond correlation. The 2006–2020 hedge relationship should be one scenario, not the assumption. Run 2022-style joint selloffs in every strategic review.
- Add real-asset risk where inflation is the binding threat. Gold and commodities did the hedging in 2022; size them by risk, with the drag in disinflationary periods agreed in advance.
- Govern volatility-scaled leverage tightly. Cap leverage, add an intra-month volatility trigger, and stress the portfolio for a sudden volatility shock from a calm starting point.
- Judge allocations by regime, not by one backtest. Require sub-period results with every proposal; a full-period Sharpe ratio can hide a decade of underperformance.
Limits
Four ETFs over twenty years cover only a few macro regimes. Institutional risk-parity programmes use more assets, futures and cheaper financing, and target risk differently. ETF expense ratios are embedded in the prices. Volatility estimates use a fixed 63-day window chosen in advance; other windows would change the details. Nothing here is a forecast or investment advice.

Sources
Data
- SPY, TLT, GLD and DBC daily prices and dividend events, Yahoo Finance; U.S. Department of the Treasury daily par yield curve (3-month bill). Copy used: huggingface.co/datasets/defeatbeta/yahoo-finance-data (ODC-BY)
Methods referenced
- Qian, E. (2005). Risk Parity Portfolios: Efficient Portfolios Through True Diversification. PanAgora Asset Management.
- Maillard, S., Roncalli, T. and Teïletche, J. (2010). "The properties of equally weighted risk contribution portfolios." The Journal of Portfolio Management, 36(4), 60–70.
- Asness, C. S., Frazzini, A. and Pedersen, L. H. (2012). "Leverage aversion and risk parity." Financial Analysts Journal, 68(1), 47–59.
- Moreira, A. and Muir, T. (2017). "Volatility-managed portfolios." The Journal of Finance, 72(4), 1611–1644.
Independent research, not investment advice. Dollar figures are illustrative. Analysis, code, charts and text were produced with AI assistance and reviewed by the author.